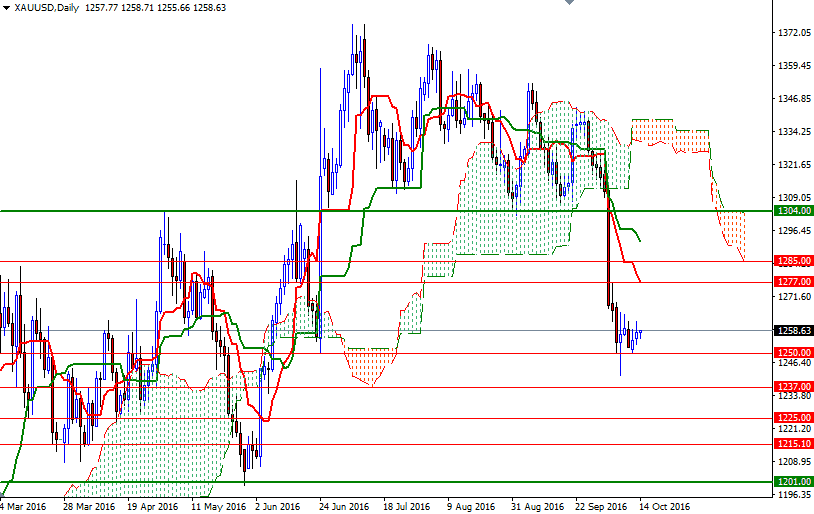
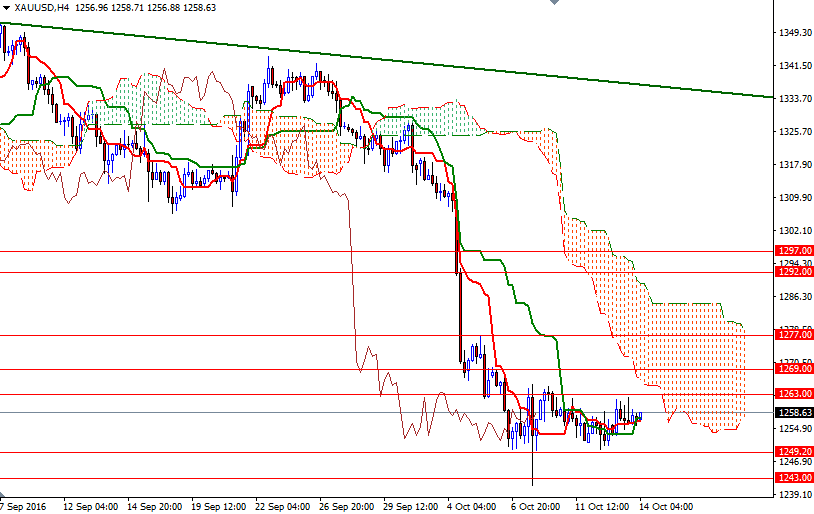
Gold rose slightly on Thursday as a retreat in the U.S. dollar helped to tempt back some buyers. The precious metal initially tried to climb above the 1263 level but the Ichimoku clouds on the 4-hour time frame offered resistance and as a result prices remained within the trading range of the previous six days. Gold is flat in Asian trade as investors await U.S. retail sales data and remarks from Federal Reserve officials. The number of people filing new claims for unemployment benefits held at a 43-year low last week, according to a report released by the Labor Department yesterday.
The key levels remains unchanged, as the market continues consolidating between the 1263 level on the top and the 1249.20 level on the bottom. The short-term outlook is bearish with prices residing below the daily and 4-hourly Ichimoku clouds. Technically, Ichimoku clouds not only identify the trend but also define support and resistance zones. The thickness of the cloud is relevant, as it is more difficult for prices to break through a thick cloud than a thin cloud.
To the downside, keep an eye on the aforementioned support in the 1250-1249.20 area. Breaching this support is essential if the bears intend to make a fresh assault on 1243/0. A break down below 1240 could see a fall to 1229.50. The bulls will have to overcome the barrier in the 1265.25-1263 zone, where the bottom of the cloud sits on the H4 chart, in order to set sail for 1270/69. If the bulls confidently push prices above 1270, look for further upside with 1277 and 1285 as targets. This area has been resistive in the so it wouldn't be surprising to see heavy selling pressure, if prices reach there.


