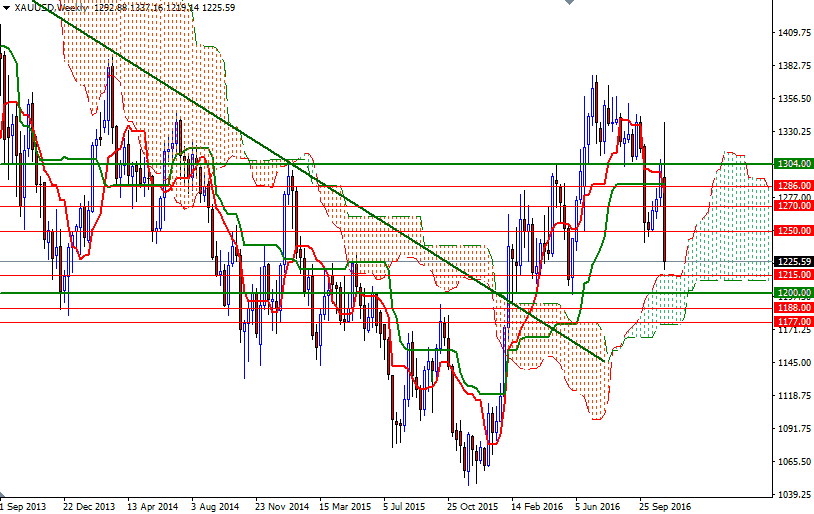
Gold ended the week down $67.29 at $1225.59, as a stronger U.S. dollar and increased appetite for riskier investments dampened demand for the metal. The market rallied all the way to the $1337 area on Donald Trump’s surprise election victory but saw strong pressure and fell sharply after investors quickly digested the results. The precious metal was also hurt by concerns about an interest-rate increase in December. Recent U.S. economic data has been generally positive.
Trading below the Ichimoku clouds on the daily and 4-hourly charts suggest that the market is likely to continue to suffer from the bearish short-term outlook. We have negatively aligned Tenkan-Sen (nine-period moving average, red line) and Kijun-Sen (twenty six-period moving average, green line) lines on both the weekly and 4-hourly charts, along with Chikou Span/Price crosses in the same direction. With these in mind, I think it wouldn't be surprising to see XAU/USD heading lower to the weekly cloud before finding some support.
To the downside, the initial support stands at 1215 (the top of the weekly cloud) followed by 1210/8 (the 50% retracement of the bullish run from 1046.33 to 1375.10). If the market convincingly breaks below 1208, we might see an extension towards the 1200-1197 area, which is the next key support on the charts. The bears will have to capture this camp so that they can reach 1189/6. Once below that, the market will be targeting the 1180/77 zone. In order to ease the downward pressure, the bulls need to lift prices above the 1237 level. Penetrating this barrier could trigger a reaction targeting the 1243/0 area. If XAU/USD passes through 1243, we could see a push up to 1250/49. Only a daily close beyond 1250 could give the bulls a chance to approach the 1262/0 area.


