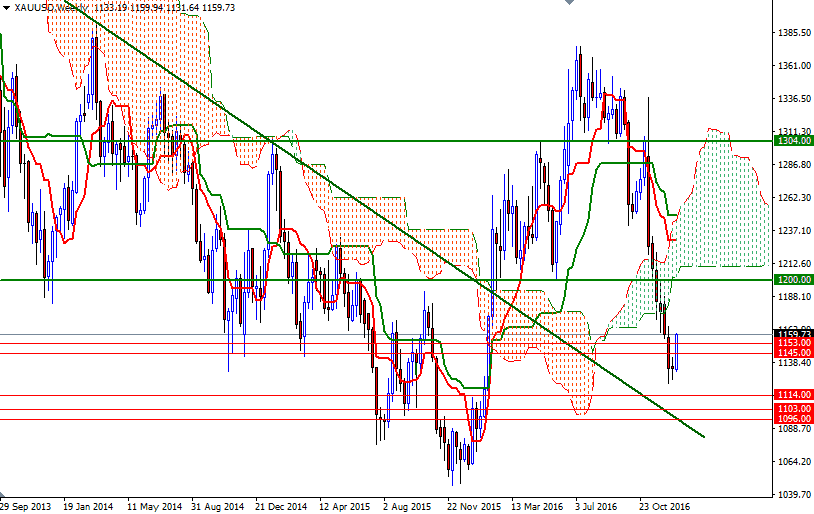
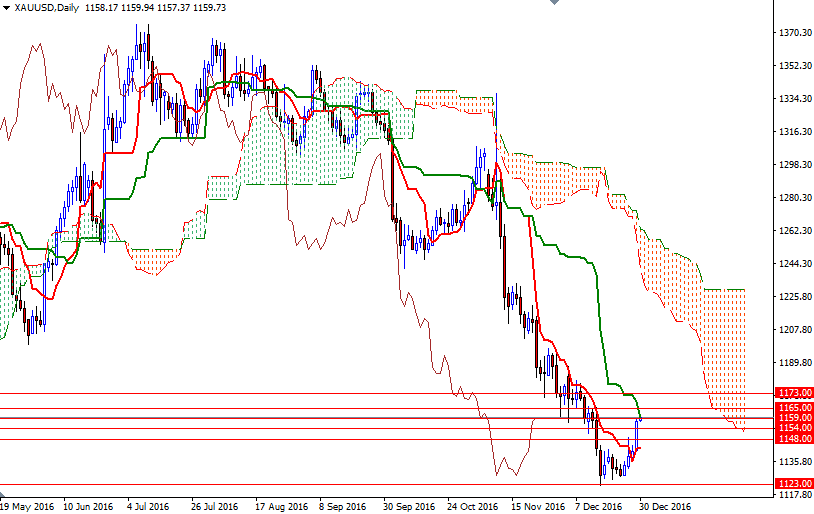
Gold began this year trading at $1062 an ounce. For the first half of the year, the precious rallied from that low to $1375 at the beginning of July as the greenback remained weak on perception that bleak economic growth, along with global issues, would keep the Federal Reserve from raising interest rates four times as it projected. Then the market spent three months consolidating, to form a descending triangle. After that gold prices broke below the $1304 support and accelerated their decline following the U.S. presidential election in November. The XAU/USD pair traded as low as $1122.55 a couple of weeks ago after the Fed announced its first rate hike in 2016.
Although the metal gave up the majority of earlier gains, prices are up approximately $98. Expectations that the Federal Reserve will continue to tighten the monetary policy should weigh on the market. Higher bond yields will also be bad for gold but there are other facts to consider. First of all, how much (and how fast) Trump can overheat the U.S. economy is an unknown. Secondly, the Federal Reserve is usually optimistic about the growth of the economy and inflation but there is a difference between the dot-plots and reality. If Trump’s fiscal plans don’t materialize and it becomes clear that the Fed won’t be able to raise interest rates as much as they expect, then that could ultimately push gold higher. On the other hand, if Trump is able to move his spending plans forward and investors continue to pour money into stocks, the precious metal will face a further downward pressure.
From a technical perspective, the big picture is slightly bearish, with the market residing below the Ichimoku clouds on the weekly and daily time frames. However, shorter term charts suggest that a retest of 1212.60-1200 is likely if the 1177/3 zone is cleared successfully. A weekly close above 1230/25 would indicate that the 1270/65 area will be the next stop. Beyond that, the bears will be waiting in the 1311/04 zone where the top of the weekly Ichimoku cloud on a former support coincide. If XAU/USD fails to hold above 1148/5, the outcome of the next test of 1125/3 will confirm what happens next. Down below, there is a critical support area between 1103 and 1096. So, we need to get down below there in order to continue to the downside. If the XAU/USD makes a sustained break below 1096, then look for further downside with 1080/75 and 1060 as targets.


