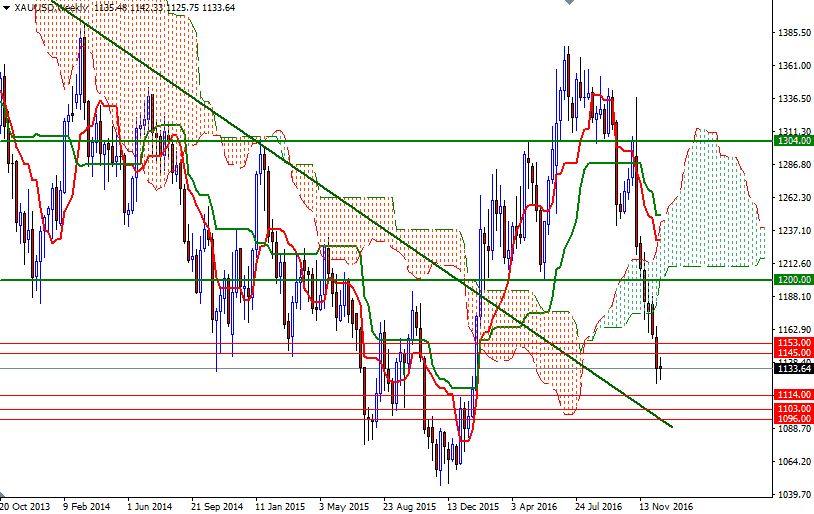
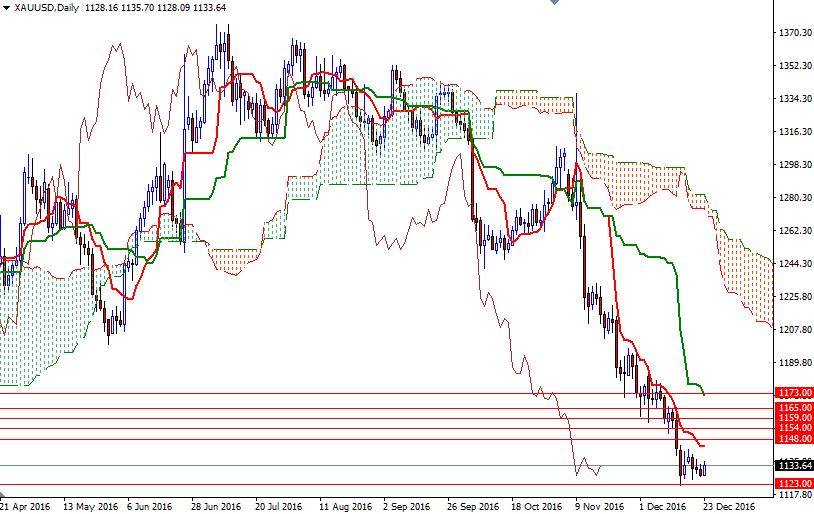
Gold prices settled at $1133.64 an ounce on Friday, ending the week just below where they started, as traders digested a series of mixed U.S. data releases. The latest data from the Commodity Futures Trading Commission (CFTC) showed that speculative traders on the Chicago Mercantile Exchange reduced their net-long positions in gold to 114834 contracts (the lowest level since mid-February), from 129311 a week earlier. Trading below the weekly and the daily charts indicates that the big picture (still) looks bearish but as you can see the market is stuck in a tight trading range for the past six trading days and the candlesticks are showing no sign of real momentum.
That said, I think XAU/USD will tend toward consolidation between the 1148/5 area on the top and the 1125/3 area on the bottom for some more time, though beware that thin market conditions before the year's end could exacerbate price movements. Alternatively, a breakout, either above or below the range, could inject volatility into the market.
If the bulls take the reins and push prices beyond 1148/5, the market will be targeting 1154/3 next. Penetrating this barrier would pave the way towards 1160/59. Beyond that, the 1167/5 zone stands out as an obvious key resistance. Only a daily close beyond 1167 could give the bulls some extra fuel they need to test the 1173 level. However, a break below the 1157 support could change the situation as it opens up the risk of a move towards 1114/1. Below 1111, the 1103 level stands out and the bears will have to demolish this significant support so that they can visit 1096 afterwards.


