Gold prices ended the month up 5.2% at $1210.23 an ounce, benefited from uncertainty about the nature and direction of U.S. President Donald Trump economic policies and a weaker dollar. Gold is usually inversely correlated with the main reserve currency (USD) and correlated with the second reserve currency (EUR). The greenback came under pressure after Trump described the currency as “too strong”. While some investors think that the U.S. Federal Reserve won’t be aggressive as it wants to be, Janet Yellen pointed strongly to the prospect of further interest rate increases this year.
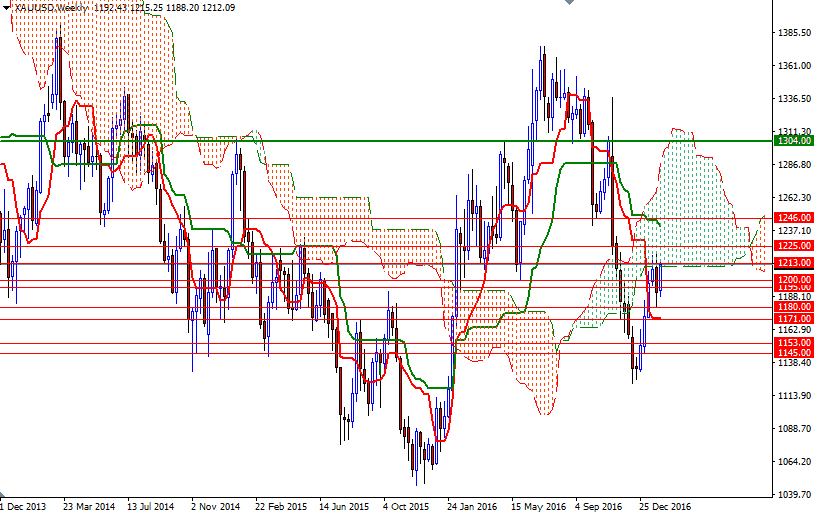
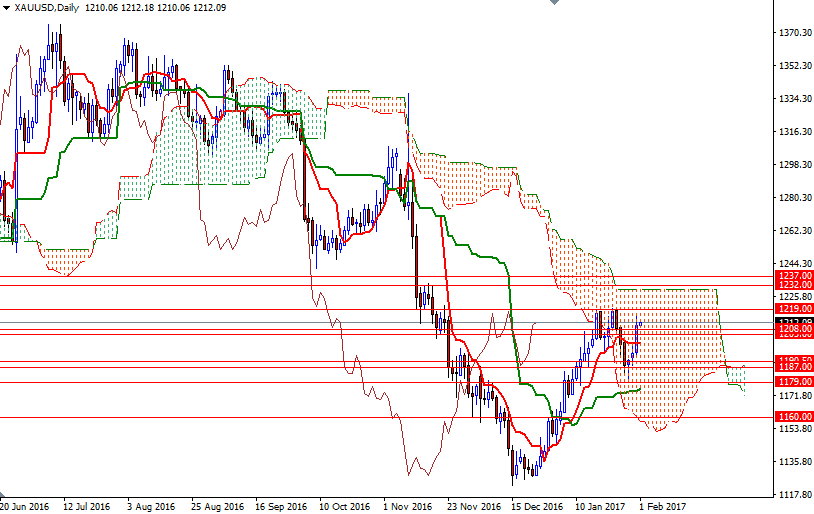
Although U.S. interest rates play an important role in the gold market, there are other key events in the equation which may whet investor appetite for safe-haven diversification - we can expect Trump and Europe to be in the headlines a lot this year. The short-term charts are slightly bullish at the moment, with the market trading above the 4-hourly and hourly the Ichimoku clouds, but as you can see there is an anticipated resistance in the 1220/19 area. That means the upside potential will be limited unless the XAU/USD pair anchors somewhere beyond there. Also note that the market is trading inside the daily Ichimoku cloud the weekly cloud is right on top of us. Breaking through 1220/19 would be a bullish sign but it won’t be an easy ride.
A sustained break above 1225 would indicate that the 1250/46 area will be the next stop. The bulls have to capture this strategic camp so that they can make a run for the 1270/65 area. To the downside, the bears have to clear nearby supports such as 1200-1199 and 1190.50-1187 if they don’t intend to give up. Falling through 1187 would open up the risk of a move towards the 1179/7 zone. Once below 1177, look for further downside with 1171/69 and 1160/57 as targets.


