Gold prices settled at $1219.35 an ounce on Friday, gaining 2.26% on the week, as the weakness in the U.S. dollar continued to lure buyers into the market. In recent weeks, the Trump administration’s concerns about the strength of the currency has prompted investors to reduce their long positions in dollar. The greenback remained weak on Friday after the jobs data reduced the likelihood of March rate hike. Figures from the Labor Department showed a monthly net gain of 227000 jobs, an unemployment rate rising to 4.8% and a slowdown in wage growth.
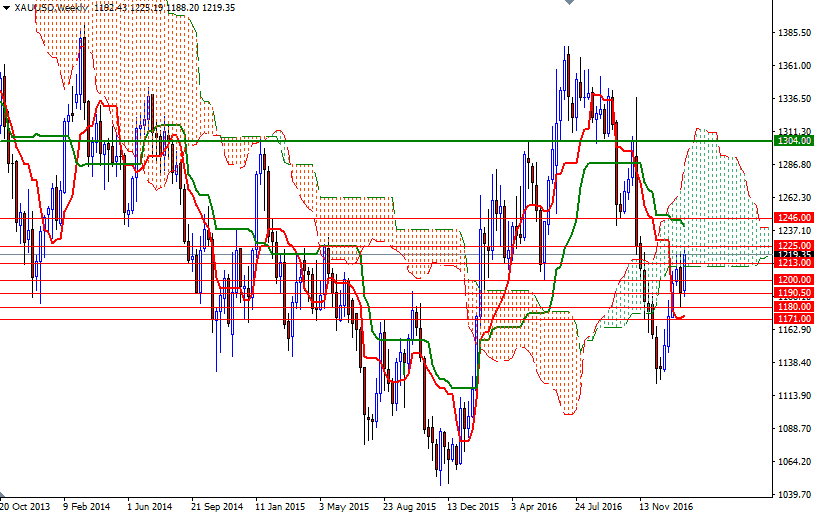
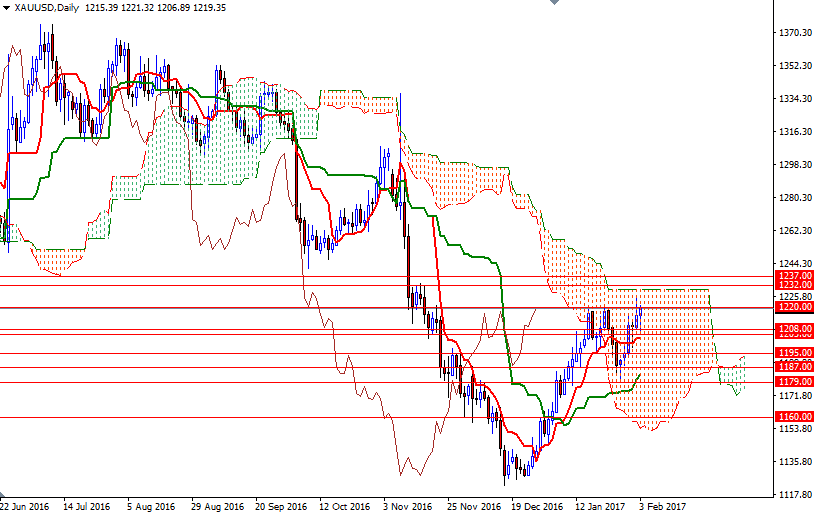
It appears that some investors are still a bit worried about Donald Trump's leadership style and aggressive words. The latest data from the Commodity Futures Trading Commission (CFTC) revealed that speculative traders on the Chicago Mercantile Exchange increased their net-long positions in gold to 119155 contracts, from 109407 a week earlier. The key levels I underlined in my monthly analysis and overall technical picture is more or less unchanged. XAU/USD is residing above the Ichimoku cloud on the 4-hour time frame. The Tenkan-Sen (nine-period moving average, red line) and the Kijun-Sen (twenty six-period moving average, green line) are positively aligned on the daily and 4-hourly charts. While all these indicate that the bulls have the near-term technical advantage, beware that the market is moving inside the weekly and daily clouds.
The first hurdle gold needs to jump is located at the 1225 level. If the bulls can maintain the control and push prices beyond 1225, then it is likely that the 1232/0 area will be the next stop. The bulls will have to overcome this barrier so that they can set sail for the 1250/46 zone. A daily close below 1250 would pave the way for a test of the 1270/65 area. To the downside, the bears have to clear nearby supports such as 1213/2 and 1208/5 unless they intend to give up. The bears will have to drag prices below the 1200-1198 zone so that they can force the market to revisit 1195. If the fall doesn't halt at 1195, we should return to the 1190.50-1187 region. Dropping through 1187 would encourage sellers and open a path to 1179/7.


