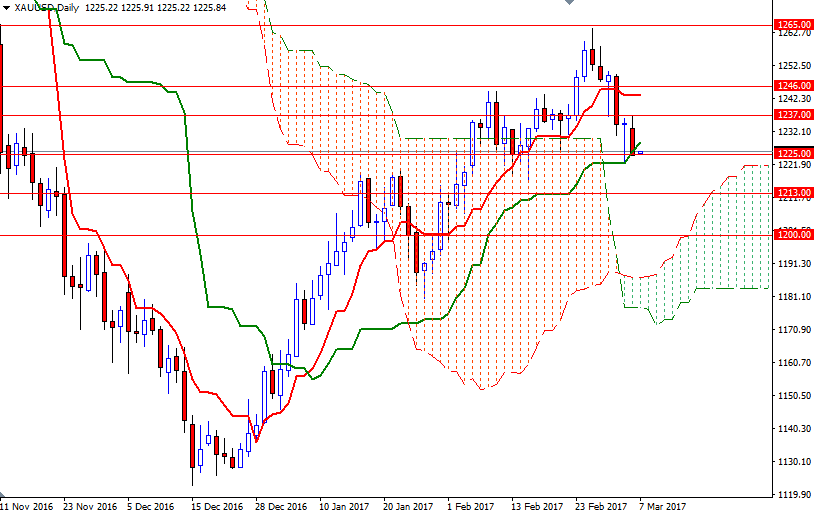
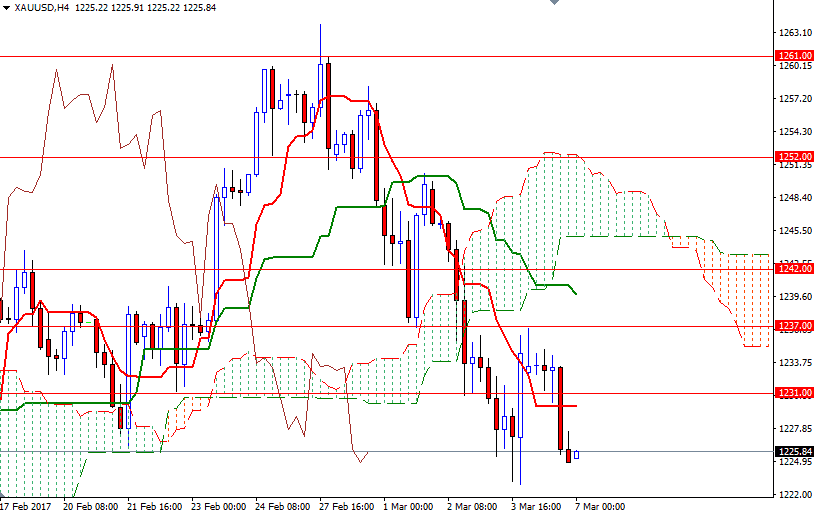
Gold prices dropped $8.07 on Monday, extending last week’s losses, as growing confidence that U.S. interest rates will rise this month outweighed haven buying amid political uncertainty in France. The XAU/USD pair initially tried to break out to the upside but the anticipated resistance in the $1238/7 area kicked in and capped the market. Consequently, the market fell through $1231/29 and tested the support at around the $1225 level.
This area produced only a slight bounce so far today but from a technical perspective, trading below the Ichimoku clouds on the 4-hour chart suggests XAU/USD is vulnerable to the downside. However, at this point, there are two more things to pay attention. First of all, prices are still above the daily cloud and the Tenkan-sen (nine-period moving average, red line) and the Kijun-sen (twenty six-period moving average, green line) are positively aligned on the same chart. Secondly, being trapped within the borders of the cloud on the weekly chart means the XAU/USD pair will be range bound for a period of time.
If the bulls fail to defend their camp at 1225 and price drop below the bottom of last week's low of 1222.88, then the market will probably visit the 1219/7 region. A break below there could send prices back to 1213/1 area where the bottom of weekly cloud also stands. Closing below 1211 on a daily basis would imply that the 1208/5 zone will be the next stop. Currently the initial resistance sits in the 1233.50-1231 region occupied by the Ichimoku cloud on the H1 chart. If prices break and manage to hold above that barrier, we could see XAU/USD extending its gains and proceeding to the 1238/7 area. Beyond that, the 1246/2 zone stands out as an obvious key resistance.


