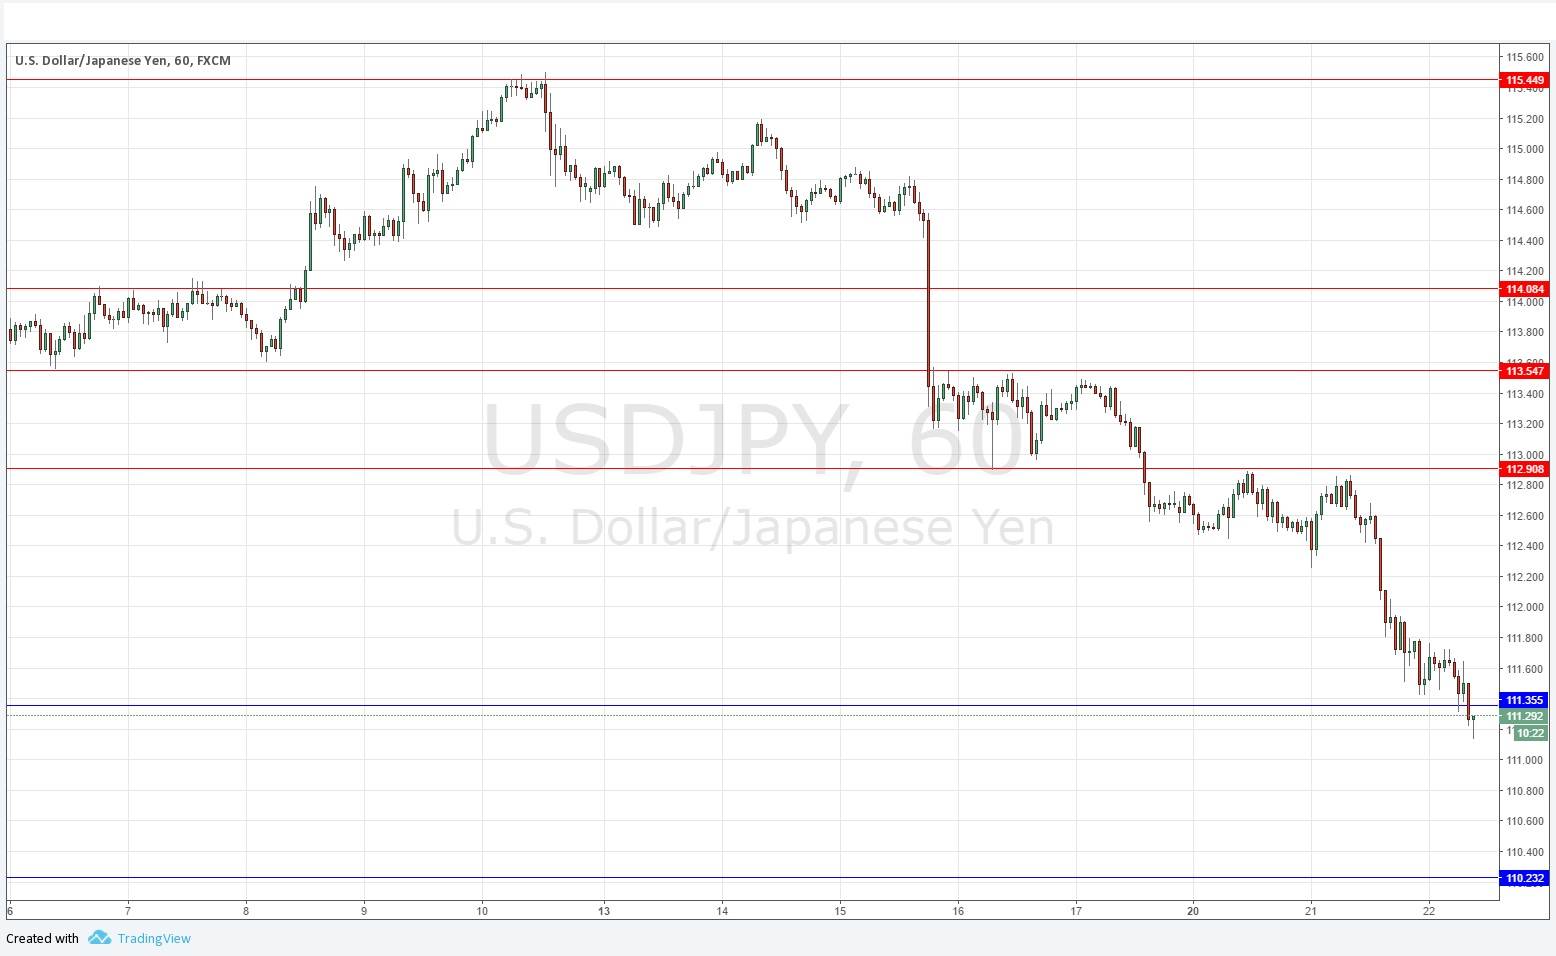
Yesterday’s signals were not triggered as there was insufficiently bullish price action at 111.36.
Today’s USD/JPY Signals
Risk 0.75%.
Trades may only be taken between 8am New York time and 5pm Tokyo time, over the next 24-hour period.
Long Trade 1
Long entry following a bullish price action reversal on the H1 time frame occurring upon the next touch of 110.23.
Put the stop loss 1 pip below the local swing low.
Move the stop loss to break even once the trade is 20 pips in profit.
Remove 50% of the position as profit when the trade is 20 pips in profit and leave the remainder of the position to run.
Short Trade 1
Short entry following a bearish price action reversal on the H1 time frame immediately upon the next touch of 112.91.
Put the stop loss 1 pip above the local swing high.
Move the stop loss to break even once the trade is 20 pips in profit.
Remove 50% of the position as profit when the trade is 20 pips in profit and leave the remainder of the position to run.
The best method to identify a classic “price action reversal” is for an hourly candle to close, such as a pin bar, a doji, an outside or even just an engulfing candle with a higher close. You can exploit these levels or zones by watching the price action that occurs at the given levels.
USD/JPY Analysis
I wrote yesterday that there were no key support levels before 111.36, so there could be a substantial drop, with the price having a lot of room to fall. This was contradicted by the longer-term chart formation which was suggesting a consolidation, but as it happened, there was a strong fall to 111.36 and beyond.
The picture looks bearish, with a lot of downwards momentum. Picking a bottom looks as if it would be very difficult and risky.
There is nothing due today regarding the JPY. Concerning the USD, there will be a release of Crude Oil Inventories at 2:30pm London time.
