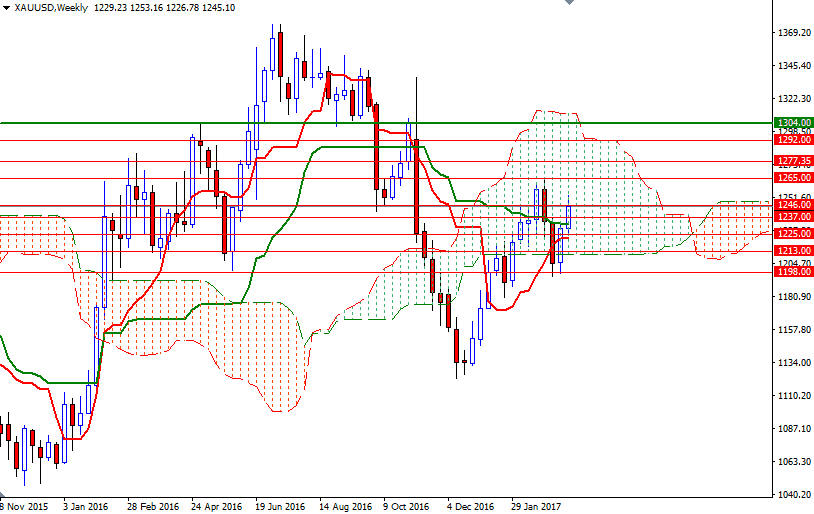
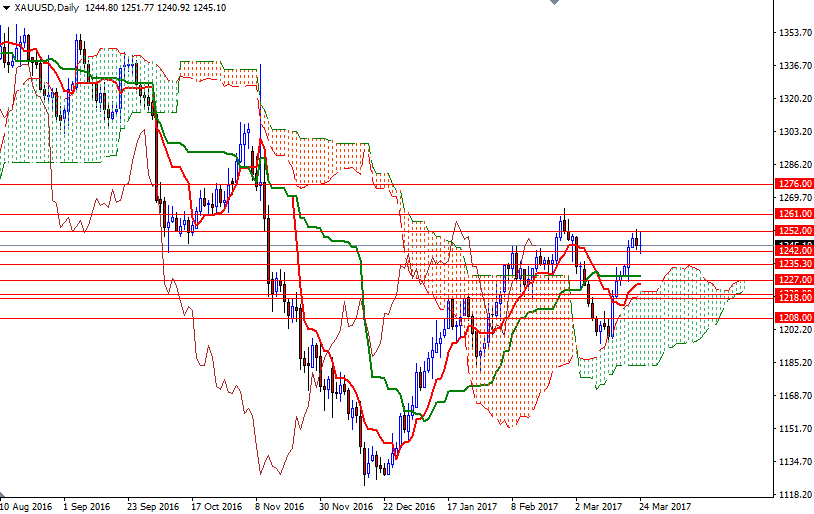
Gold prices settled at $1245.10 an ounce on Friday, gaining 1.2% on the week, as a sell-off in the U.S. stock market and a lower U.S. dollar index boosted the yellow metal. The XAU/USD pair hit the highest level since February 28 after U.S. stock markets took their biggest loss in five months as President Donald Trump’s healthcare bill ran into trouble in Congress. The latest data from the Commodity Futures Trading Commission (CFTC) revealed that speculative traders on the Chicago Mercantile Exchange increased their net-long positions in gold to 116252 contracts, from 106038 a week earlier.
Trump’s failure to secure the health bill, his first major legislation as president, has led some investors to question his ability to work with Congress. If expectations for tax reform (the main driver of a strong rally that has carried U.S. equities to record highs) dwindle, XAU/USD could benefit appreciably. From a technical perspective, trading above Ichimoku clouds the daily and the 4-hourly charts indicates that the market has a tendency to rise over the medium-term. The Chikou span (closing price plotted 26 periods behind, brown line), which is above prices, supports this view. On the other hand, the market resides in the weekly the cloud and we have negatively aligned Tenkan-Sen (nine-period moving average, red line) and Kijun-Sen (twenty six-period moving average, green line) lines on weekly and the daily time frames, warning that the market looks vulnerable to a pull-back toward the daily cloud.
The first hurdle gold needs to jump is located in the 1253/2 area. If the bulls successfully push prices above 1253, we might see a push up to the 1265/1 zone. A sustained break below 1265 would make me think that XAU/USD will proceed to 1277.35-1276. The bulls will need to clear this strategic resistance so that they can challenge 1292. However, if the support at around 1242 fails to hold, then prices will probably fall to the 1237/5 area afterwards. Once below 1235, look for further downside 1231 and 1227/5 as targets. In order to set sail for the 1220/18 region, the bears have to drag prices this critic support.


