The difference between success and failure in Forex trading is very likely to depend upon which currency pairs you choose to trade each week, and not on the exact trading methods you might use to determine trade entries and exits. Each week I am going to analyze fundamentals, sentiment and technical positions in order to determine which currency pairs are most likely to produce the easiest and most profitable trading opportunities over the next week. In some cases it will be trading the trend. In other cases it will be trading support and resistance levels during more ranging markets.
Big Picture 2nd April 2017
Last week, I predicted that the best trades for this week were likely to be long the Japanese Yen, Swiss Franc, and Euro, and short of the U.S. Dollar. None of these trades worked out well, unfortunately. The USD/JPY rose slightly, by 0.05%; the USD/CHF also rose, by 1.14%; and the EUR/USD fell by 1.18%, giving an average negative move of 0.79%.
The Forex market is in a quiet and uncertain mood, in the absence of major news. There has been a flow into such perceived safe havens such as the Japanese Yen, and precious metals such as Gold and Silver, although “risk on” assets such as the British Pound also gained this week.
The most bearish currency in general against a long-term basket of currencies remain the New Zealand and U.S. Dollars. Therefore, I suggest that the best trade of the coming week will be long the Japanese Yen, and Silver; and short of the U.S. Dollar.
Fundamental Analysis & Market Sentiment
The major element affecting the market right now is the market’s inability to really believe in the Federal Reserve’s willingness to tighten monetary policy. This has led to weakness in the greenback although the Dollar did recover somewhat at the end of the week. The U.S. Dollar is likely to be heavily influenced this week by the forthcoming releases of FOMC Meeting Minutes and the Non-Farm Payrolls numbers.
Technical Analysis
USDX
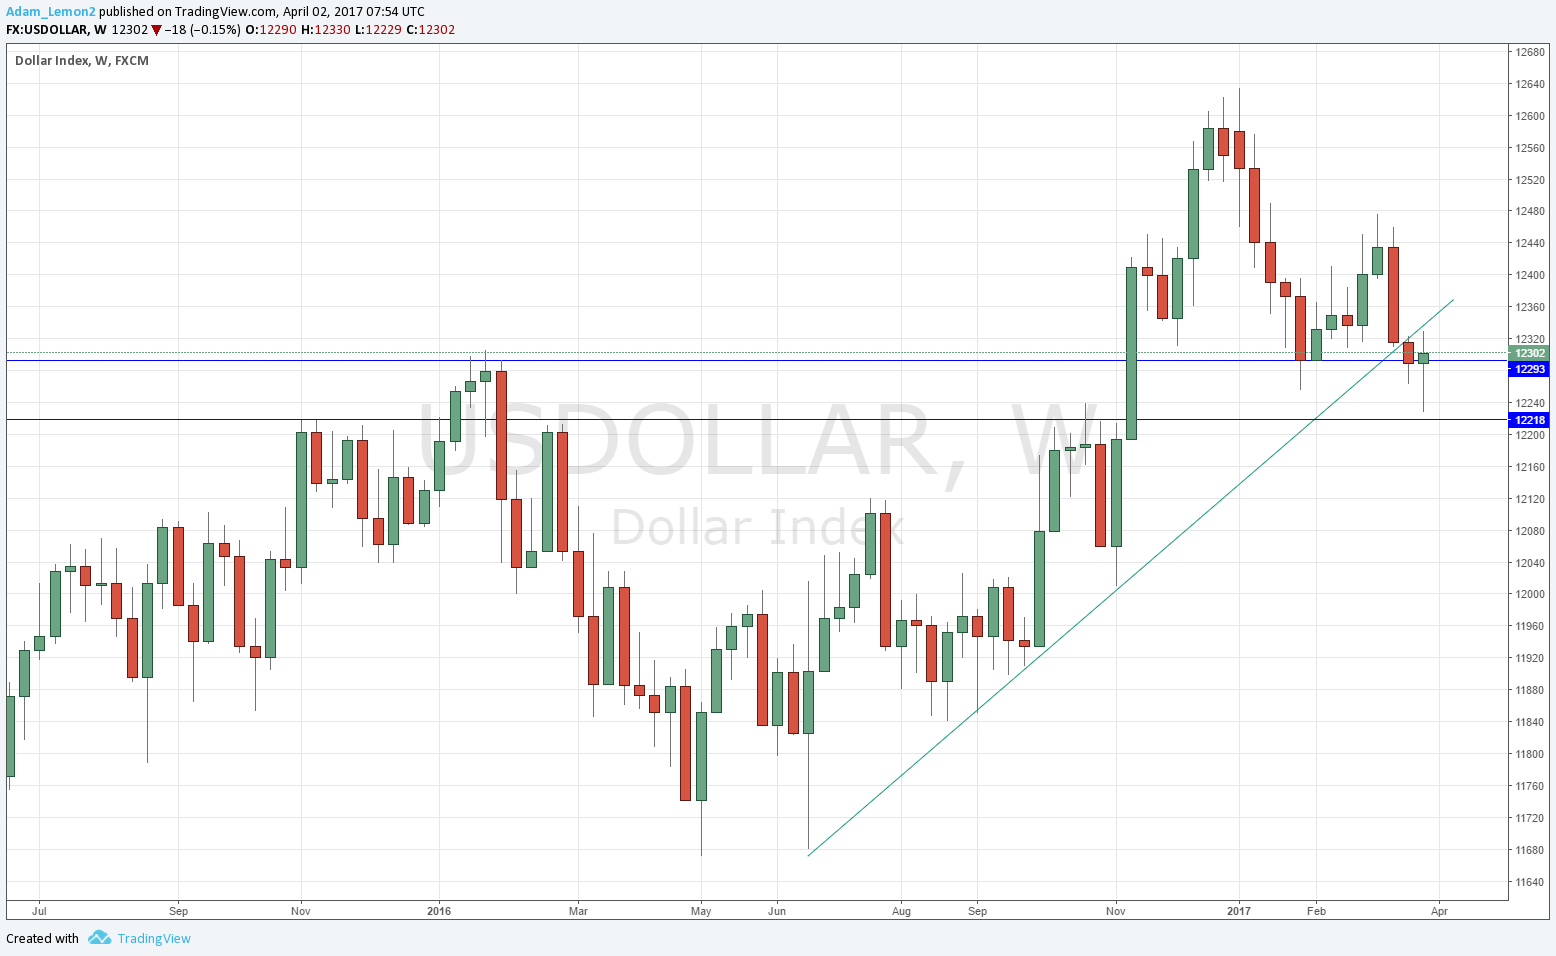
The U.S. Dollar printed a bullish candle this week, between a pin candle and a doji, with a long lower wick. The price remains below the broken bullish trend line, which is a bearish sign. The price is also well below its level of 3 months back, which is another bearish sign. However, the candle does suggest an immediate strong downwards move is unlikely as the new week opens.
USD/JPY
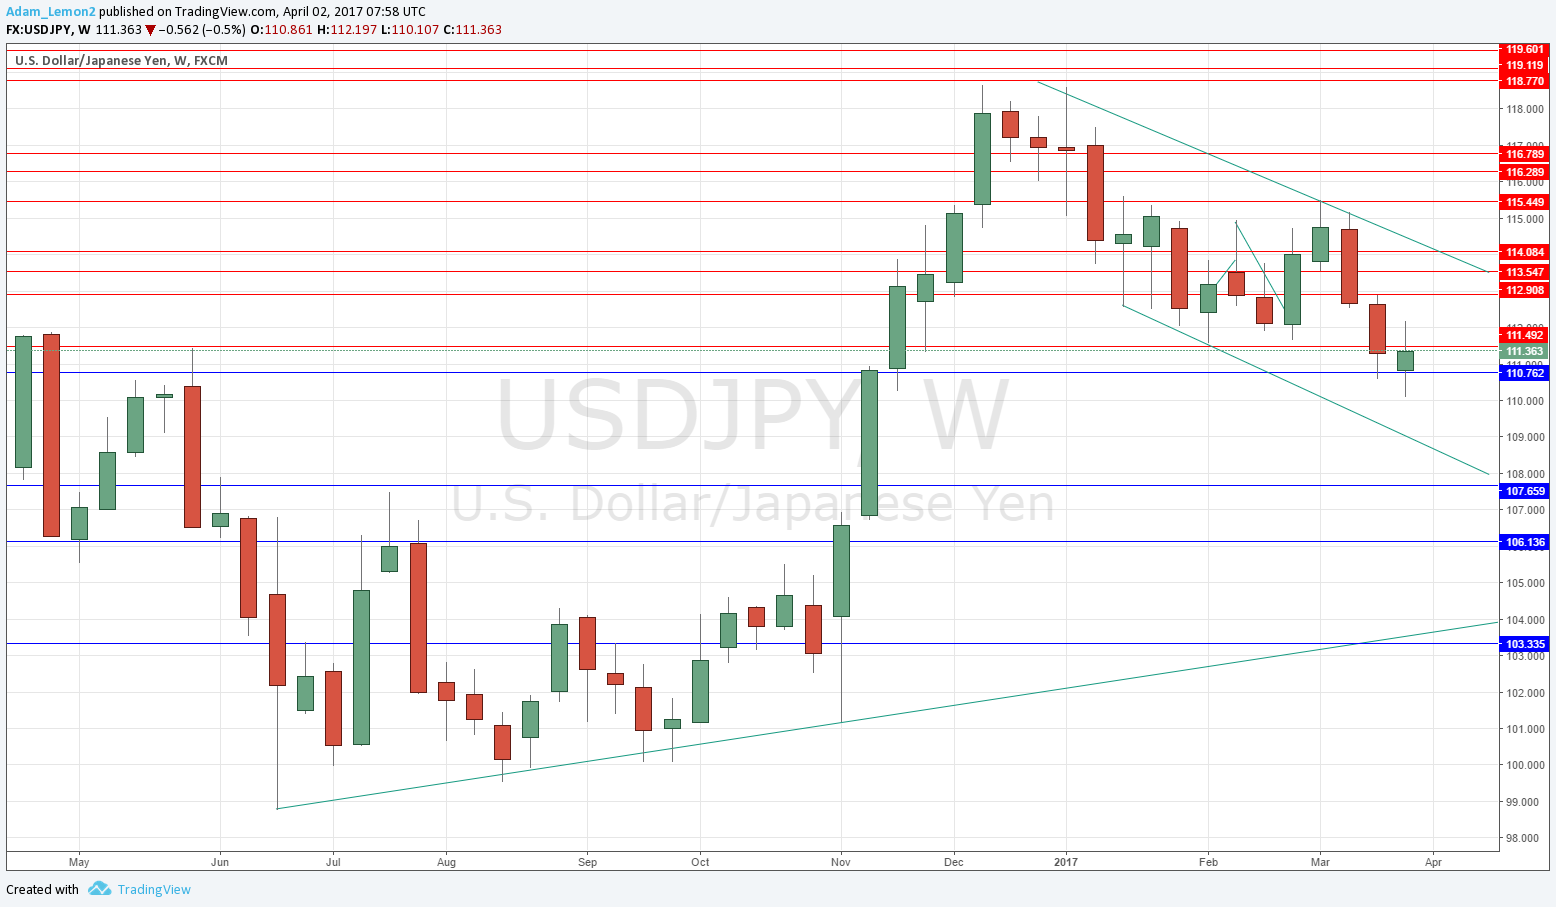
This week we see a relatively small bullish near-doji candle, breaking down to a four-month low and into “blue sky”. The price is also below its levels from 3 months back, indicative of a bearish trend. All the signs are bearish except two: the candle itself, and the fact that the area between 110.00 and 111.00 was very pivotal during 2016 and may therefore provide some support. Note also that the price is established within a bearish downwards channel as marked by the trend lines in the chart below.
GOLD
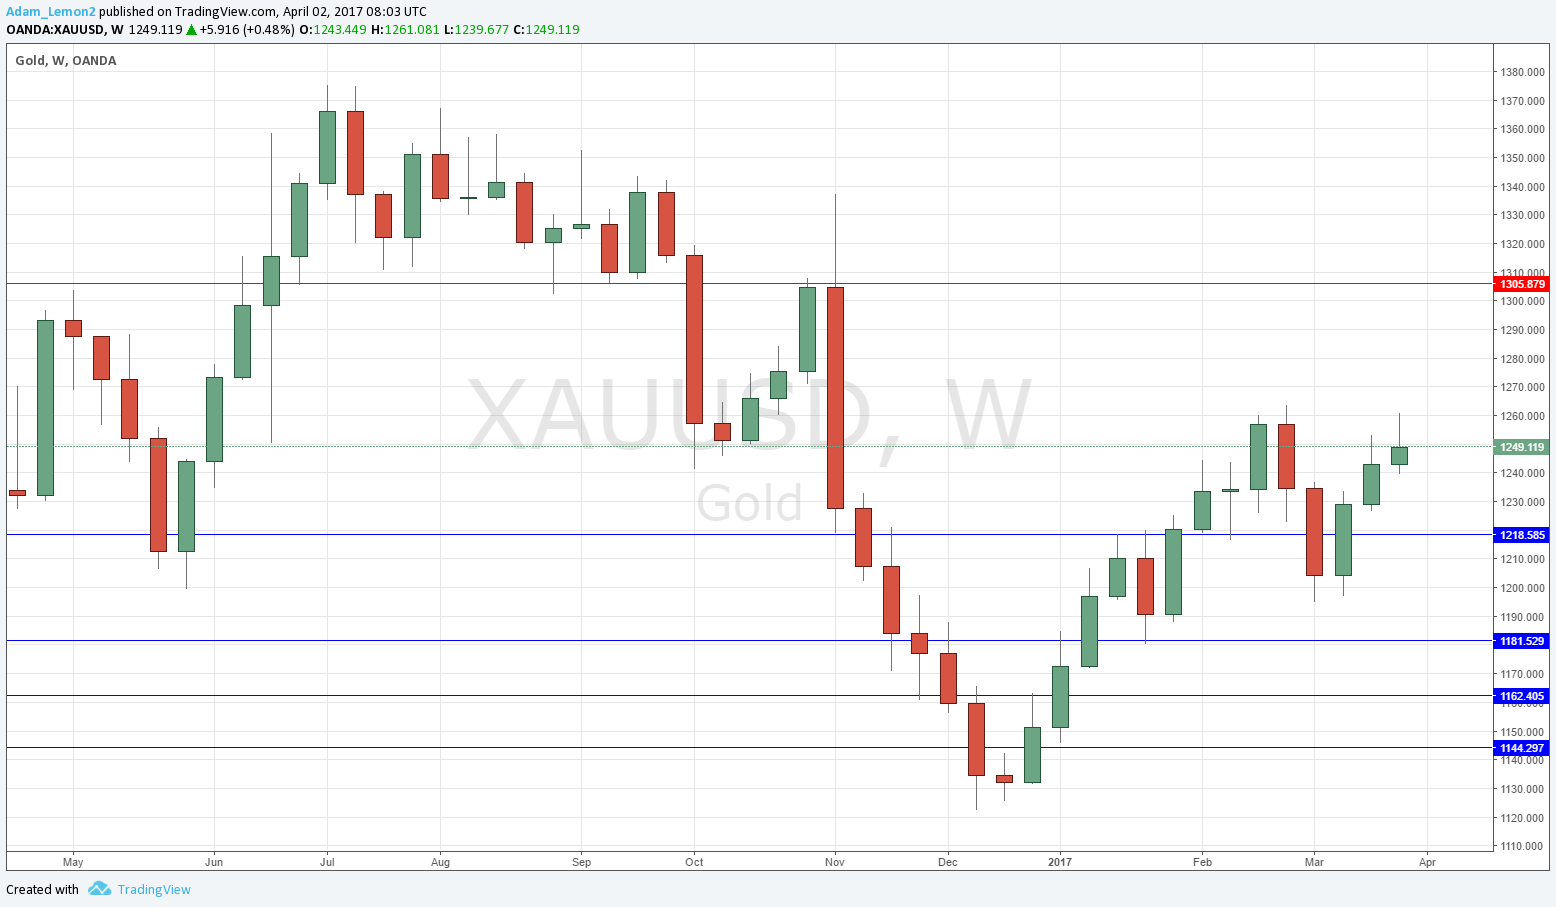
The candlesticks in the chart below show a relatively bullish pattern over the near term, but arguably the very long-term pattern is bearish. Nevertheless, the short-term momentum has been clearly with the bulls and it is not worth arguing with that. On the other hand, this week’s bullish candle is small, has a long upper wick, and failed to break the swing high at 1263.94, which are all bearish indications. I am cautiously bullish, and more optimistic about Silver (see below).
SILVER
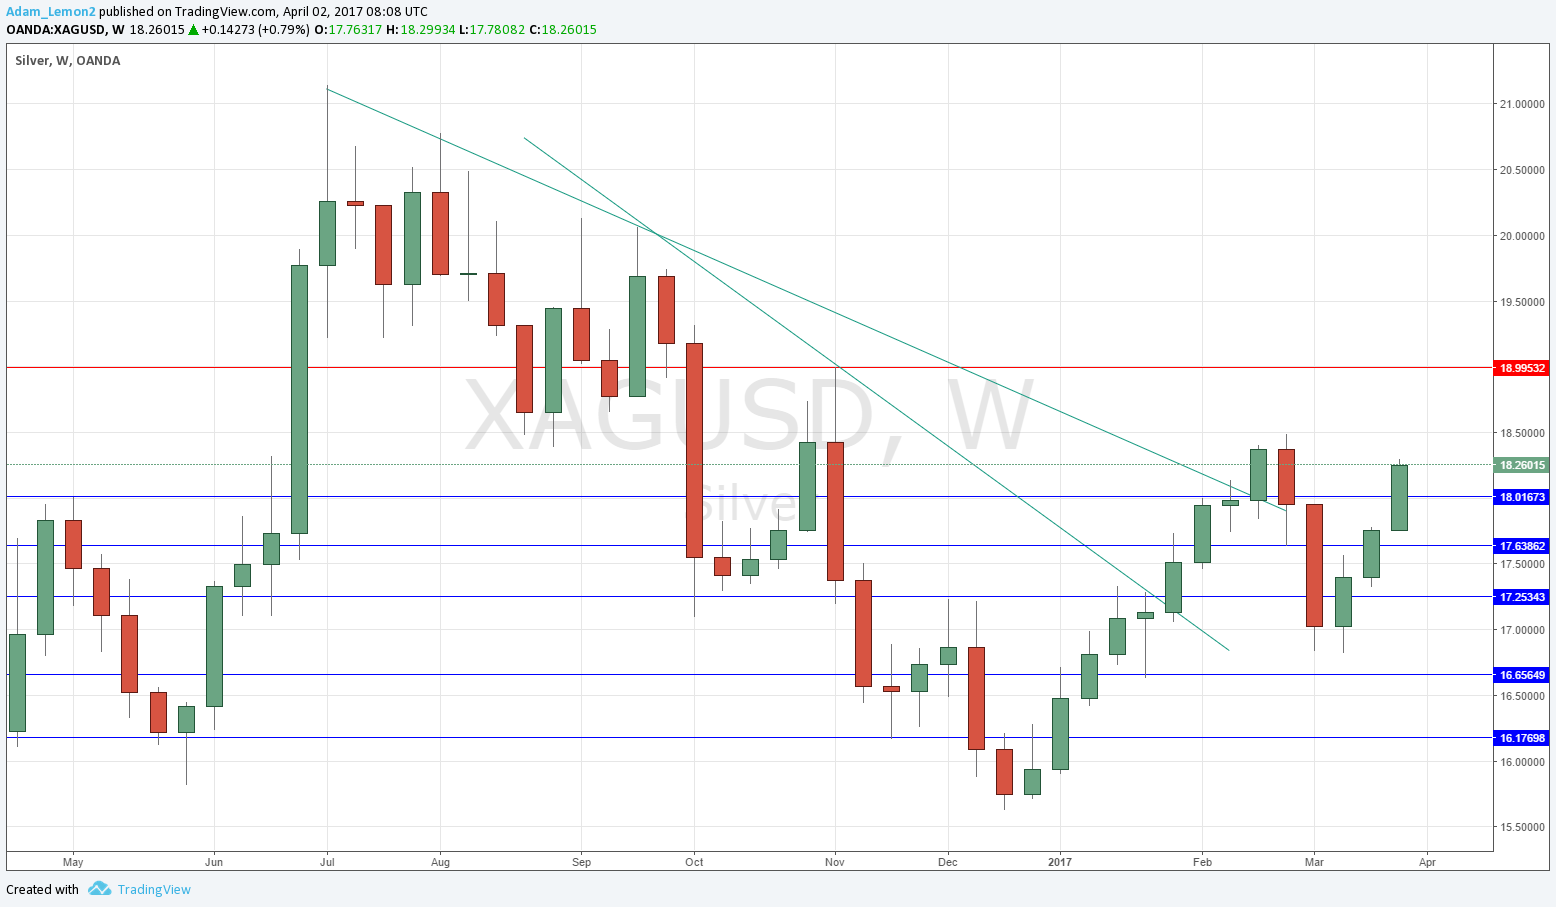
The candlesticks in the chart below show a very bullish pattern over the near term, and arguably also a bullish long-term pattern due to the broken bearish trend lines. The short-term momentum has been very clearly with the bulls and it is not worth arguing with that. This week’s bullish candle is large, and closed hard on its high. I am bullish and see this as the best trend in the market now.
Conclusion
Bullish on the Japanese Yen and Silver; bearish on the U.S. Dollar.


