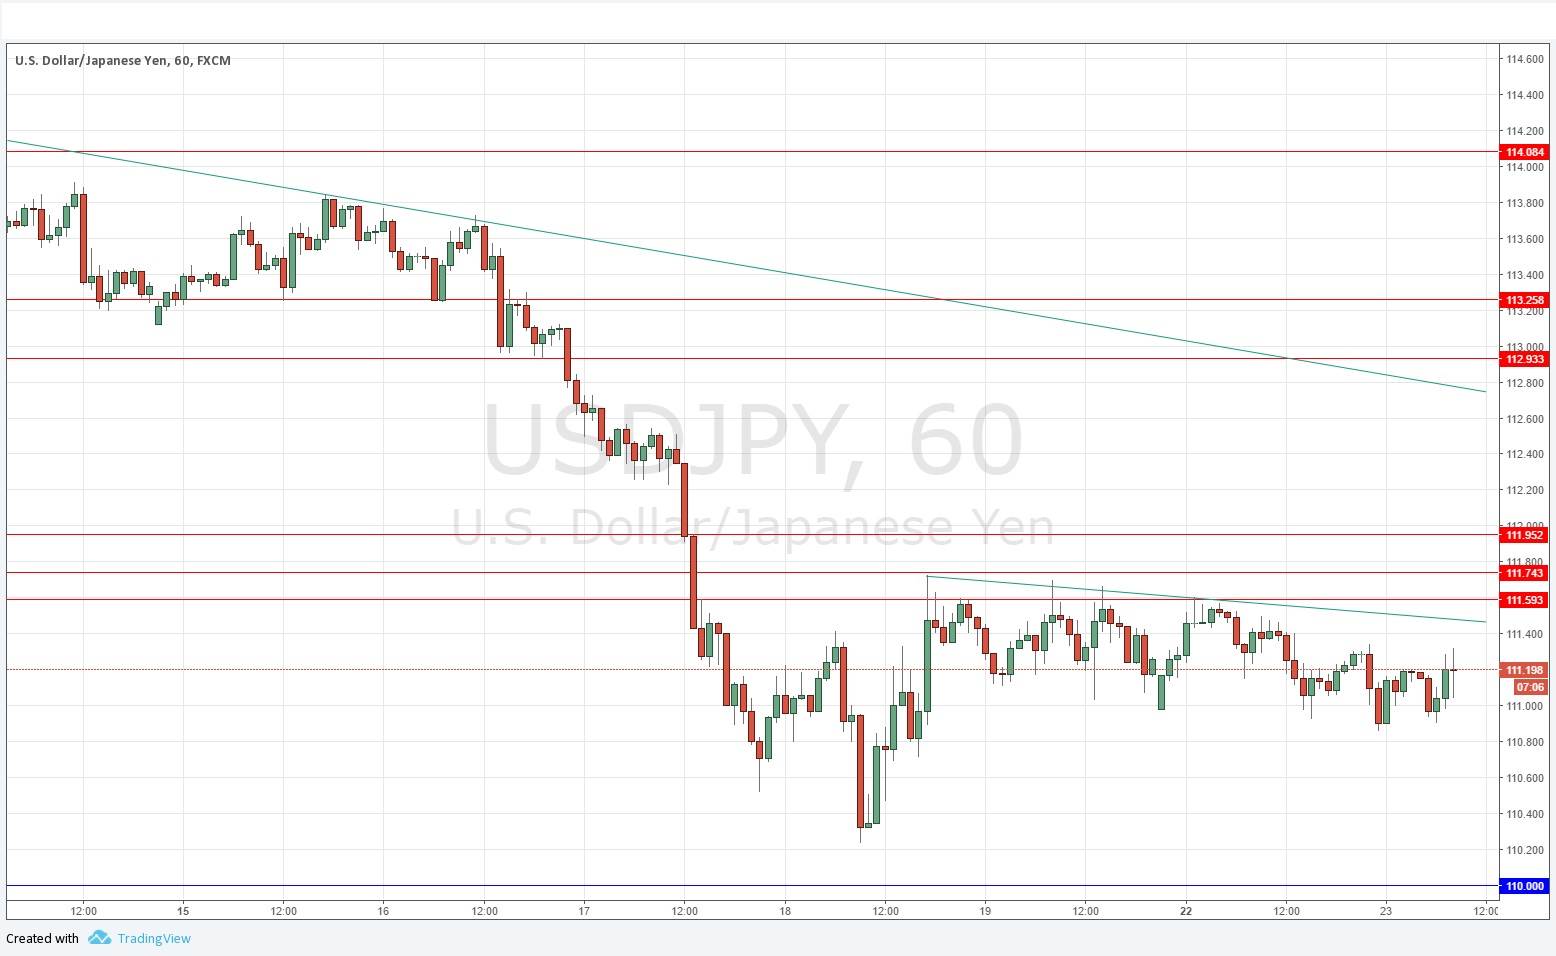
Yesterday’s signals were not triggered as none of the key levels were ever reached.
Today’s USD/JPY Signals
Risk 0.75%.
Trades may only be entered between 8am New York time and 5pm Tokyo time, over the next 24-hour period.
Short Trades
- Short entry following a bearish price action reversal on the H1 time frame immediately upon the next touch of 111.59, 111.74 or 111.95.
- Put the stop loss 1 pip above the local swing high.
- Move the stop loss to break even once the trade is 20 pips in profit.
- Remove 50% of the position as profit when the trade is 20 pips in profit and leave the remainder of the position to run.
Long Trade 1
- Long entry following a bearish price action reversal on the H1 time frame immediately upon the next touch of 110.00.
- Put the stop loss 1 pip below the local swing low.
- Move the stop loss to break even once the trade is 20 pips in profit.
- Remove 50% of the position as profit when the trade is 20 pips in profit and leave the remainder of the position to run.
The best method to identify a classic “price action reversal” is for an hourly candle to close, such as a pin bar, a doji, an outside or even just an engulfing candle with a higher close. You can exploit these levels or zones by watching the price action that occurs at the given levels.
USD/JPY Analysis
This pair remains within a very slight long-term bearish trend. The shorter-term technical picture shows the price failing to rise above the beginning of the resistant area at 111.59, so the line of least resistance looks to be downwards, in line with the long-term trend. However, we are now seeing a bottoming at about 110.90 which suggests a bullish “Quasimodo” pattern is driving the price up again over the short-term. It is a confusing picture, but if the price again fails at 111.59, it is bound to eventually drop quickly and probably reach the 110.00 level.
There is nothing due today concerning either the JPY or the USD.

