The difference between success and failure in Forex trading is very likely to depend upon which currency pairs you choose to trade each week, and not on the exact trading methods you might use to determine trade entries and exits. Each week I am going to analyze fundamentals, sentiment and technical positions in order to determine which currency pairs are most likely to produce the easiest and most profitable trading opportunities over the next week. In some cases it will be trading the trend. In other cases it will be trading support and resistance levels during more ranging markets.
Big Picture 18th June 2017
Last week, I predicted that the best trade for this week was likely to be long the S&P 500 Index, and short of the British Pound. This was a losing trade overall, but only by a tiny amount. The S&P 500 Index rose by 0.24% against the U.S. Dollar, while the British Pound also rose against the U.S. Dollar, by 0.28%. This combination produced an average loss of 0.02%.
The Forex market is in a less settled mood, with the major movements of the week all against prevailing trends. There is not much input expected this week from major central banks. Overall, this week’s outcome still looks relatively unpredictable.
Fundamental Analysis & Market Sentiment
The major element affecting market sentiment at present has been the reaction to last week’s U.S. interest rate hike of 0.25% by the FOMC, as well as the more hawkish than expected language used by Janet Yellen concerning monetary policy. It is notable that after the initial move in favor of the USD, the move seemed to halt at the end of the week, and if there is no follow though, it suggests weakness in the USD. Meanwhile, the market overall looks as if prices are mostly see-sawing and not printing any attractive trends, making directional forecasting very challenging. Another interesting feature is the stabilization of the British Pound, as it becomes clearer that the British Government should be able to continue for a few more years.
Technical Analysis
USDX
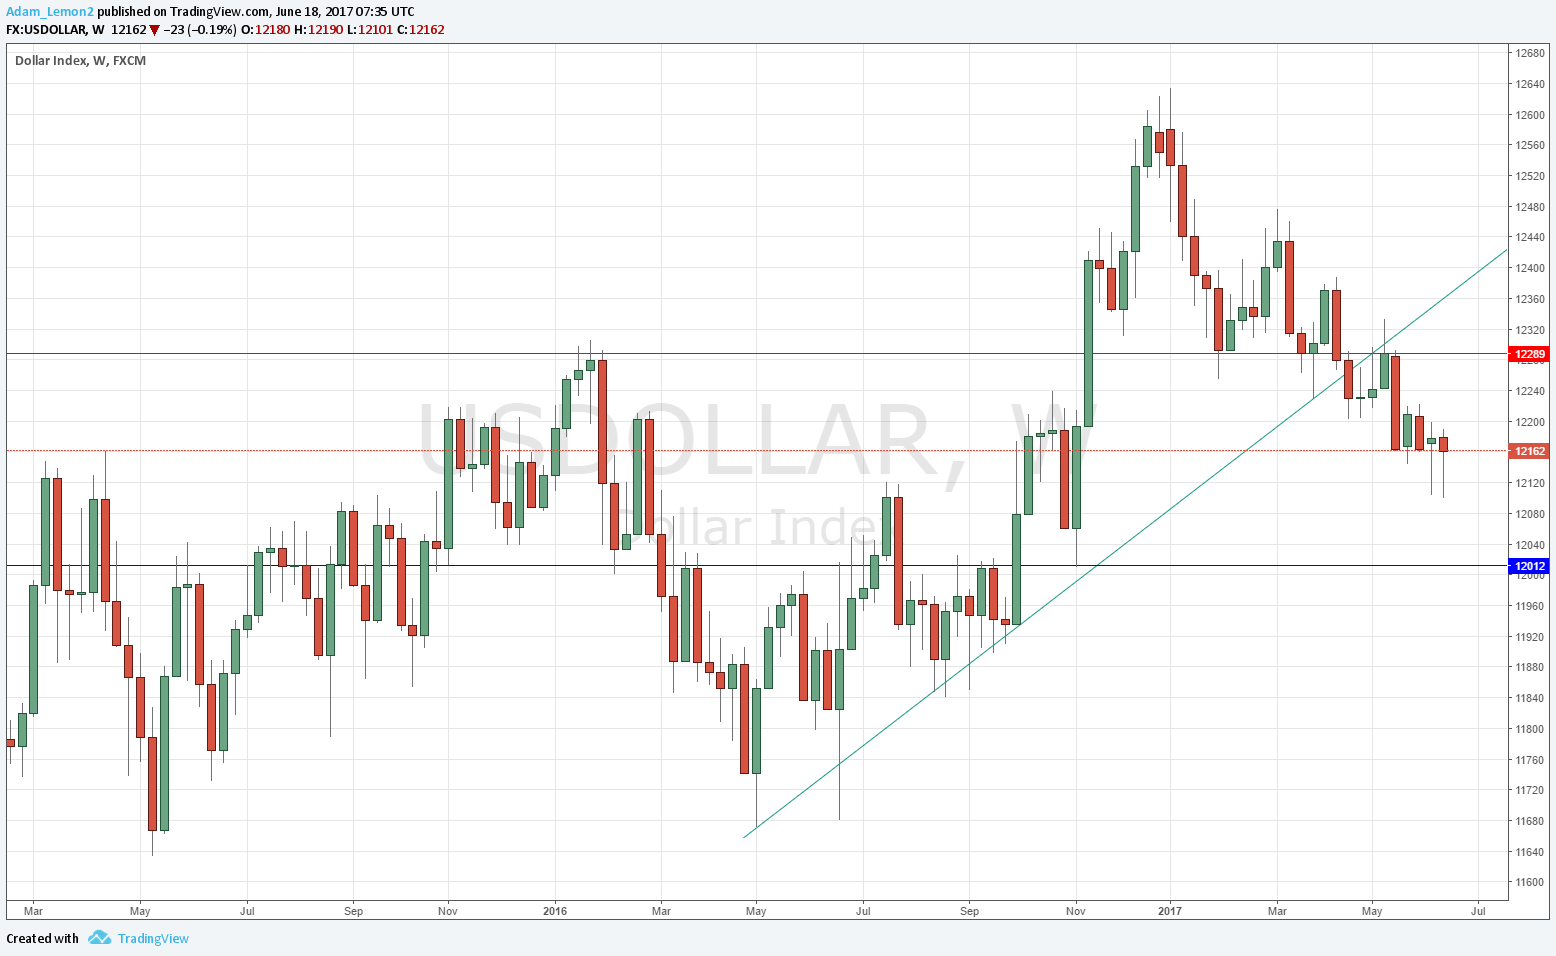
The U.S. Dollar printed a slightly bullish candle again this week. It is a near-pin candle of normal size closing not far from its open following an inside candle. The rhythm of the pattern is bearish but the last few candles are hinting at a possible upwards move, and the hint is getting a little stronger. The bullish trend line is broken and has been rejected bearishly from the broken side, with a resistance level at 12289. The price has broken convincingly below the formerly supportive level at 12203. The price is now below its historic levels from 3 months and 6 months, so has a long-term bearish trend. The signs remain mixed.
S&P 500 Index
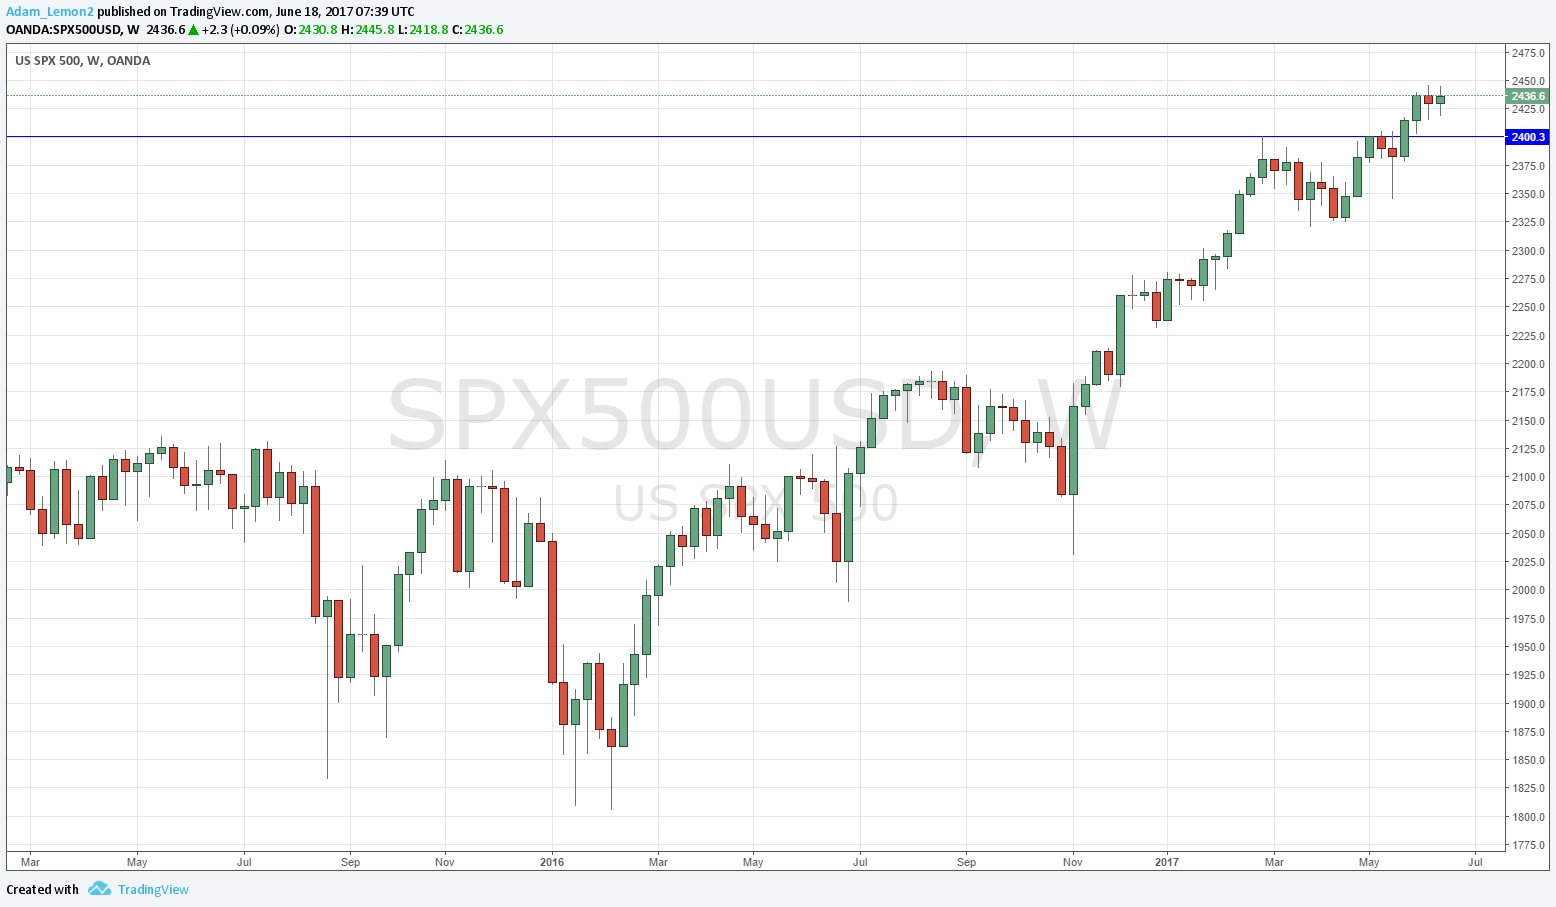
The major U.S. stock market index rose slightly this week, but not by much. During the week, the price again made a new all-time high. All-time highs should be respected and although a sharp drop in stocks can happen in such a mature bull market, statistics are on the side of the bulls. The technical picture still looks very bullish, despite the rate hike by the Federal Reserve of 0.25% last week.
Silver
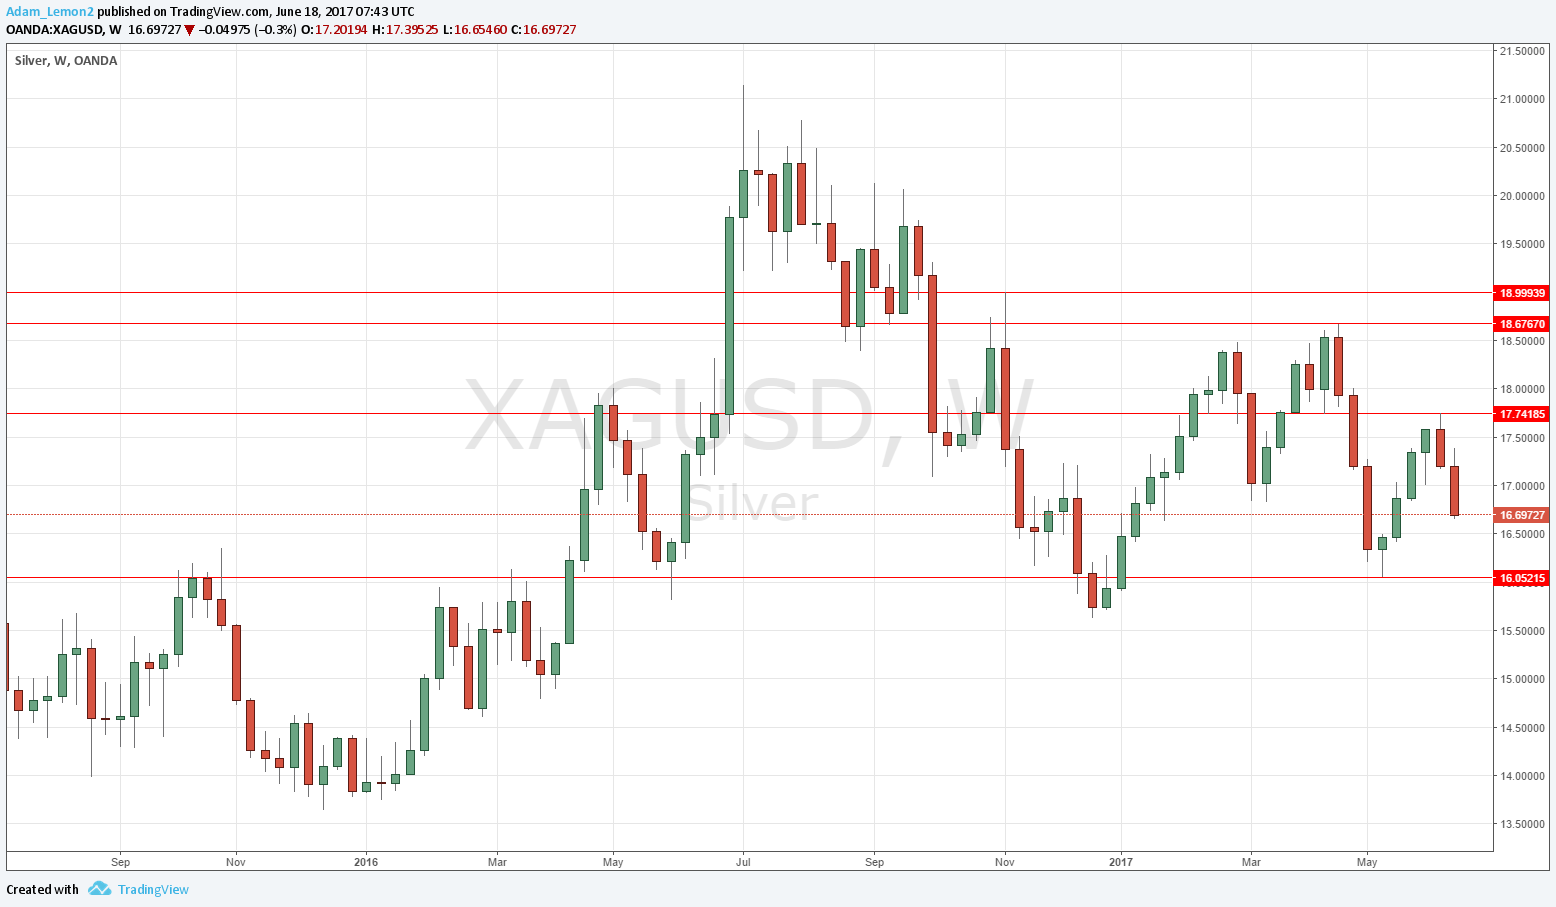
Silver has fallen quite strongly over the past couple of weeks. Although it is not in a strong long-term trend, it looks bearish, with sufficient momentum to reach the next major support area at around $16, and possibly beyond.
Conclusion
Bullish on the S&P 500 Index; bearish on Silver.


