The difference between success and failure in Forex trading is very likely to depend upon which currency pairs you choose to trade each week, and not on the exact trading methods you might use to determine trade entries and exits. Each week I am going to analyze fundamentals, sentiment and technical positions in order to determine which currency pairs are most likely to produce the easiest and most profitable trading opportunities over the next week. In some cases it will be trading the trend. In other cases it will be trading support and resistance levels during more ranging markets.
Big Picture 25th June 2017
Last week, I predicted that the best trade for this week was likely to be long the S&P 500 Index, and short of Silver, both against the U.S. Dollar. This trade produced a small loss overall, both initially going well but giving up the gains towards the end of the week. The S&P 500 Index fell by 0.11% against the U.S. Dollar, while Silver rose against the U.S. Dollar very slightly, by 0.10%. This combination produced an average loss of 0.11%.
The Forex market remains in an unsettled mood, with exceptionally low volatility and an absence of clear trends. There is again very little input expected this week from major central banks. Overall, this week’s outcome still looks relatively unpredictable.
Fundamental Analysis & Market Sentiment
The major element affecting market sentiment at present is very minor but remains the U.S. Federal Reserve, namely any comments from members of its FOMC that shed light on the pace of forthcoming rate hikes over 2017. This is also affected to a large degree by the quality of U.S. economic data releases. Sentiment is currently inconclusive, hence the quiet, see-sawing market.
Technical Analysis
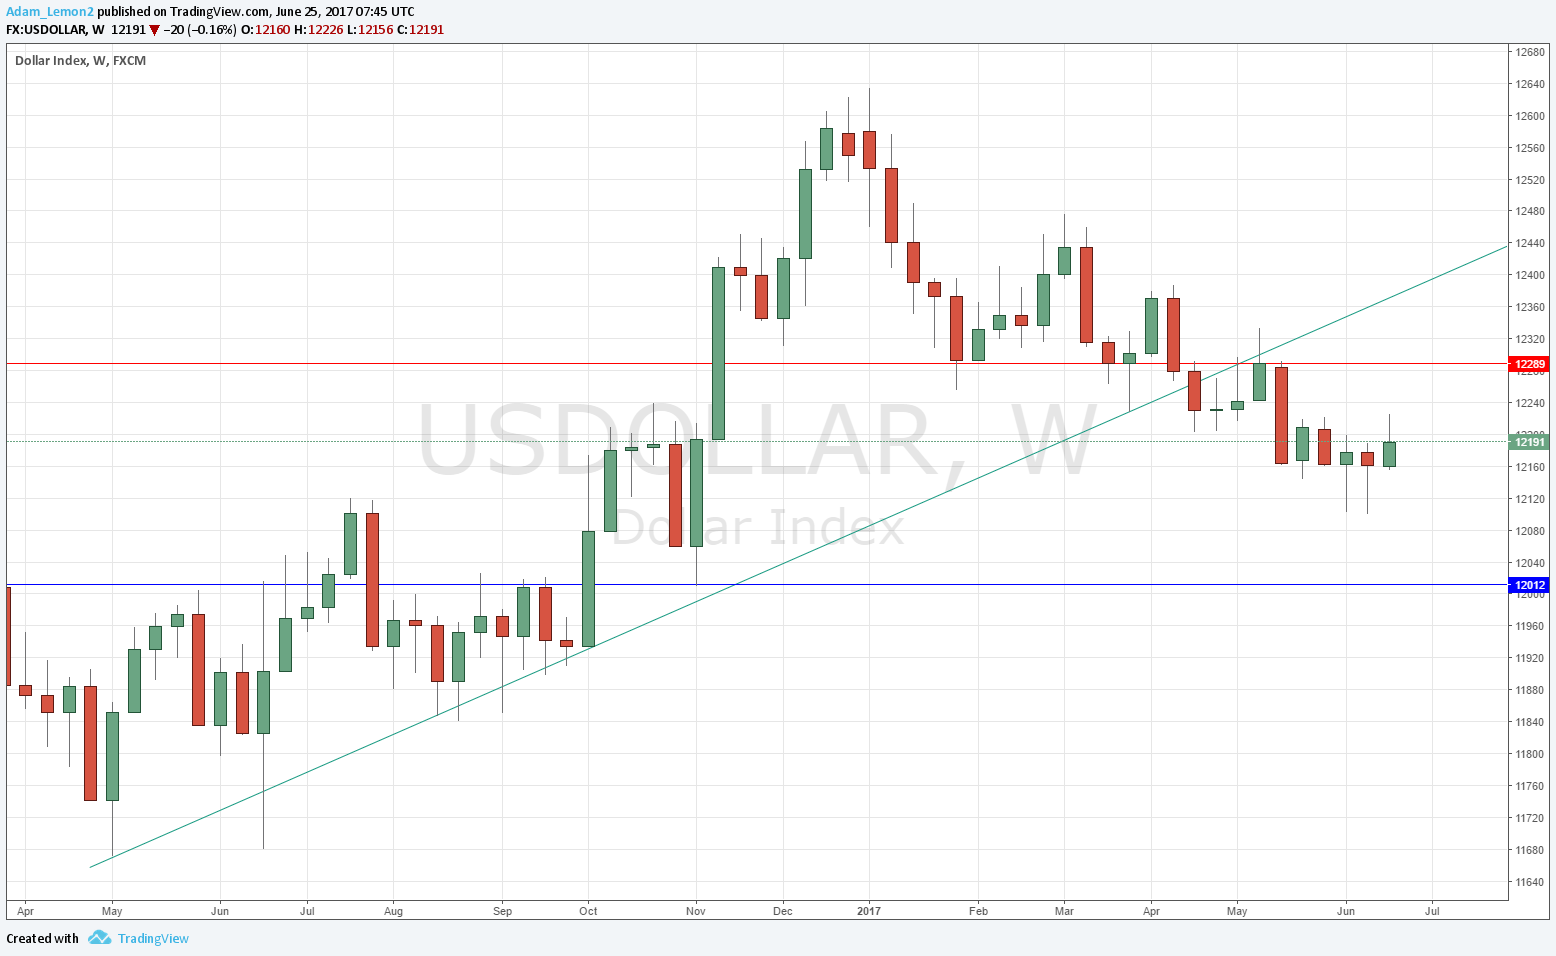
USDX
The U.S. Dollar printed a slightly bullish candle again this week, but it is a very inconclusive candle. It has a large upper wick and signifies little. The rhythm of the pattern is bearish but the last few candles were hinting at a possible upwards move, although this inconclusive candle dampens the hint. The bullish trend line is broken and has been rejected bearishly from the broken side, with a resistance level at 12289. The price has broken convincingly below the formerly supportive level at 12203. The price is now below its historic levels from 3 months and 6 months, so has a long-term bearish trend. The signs remain mixed.
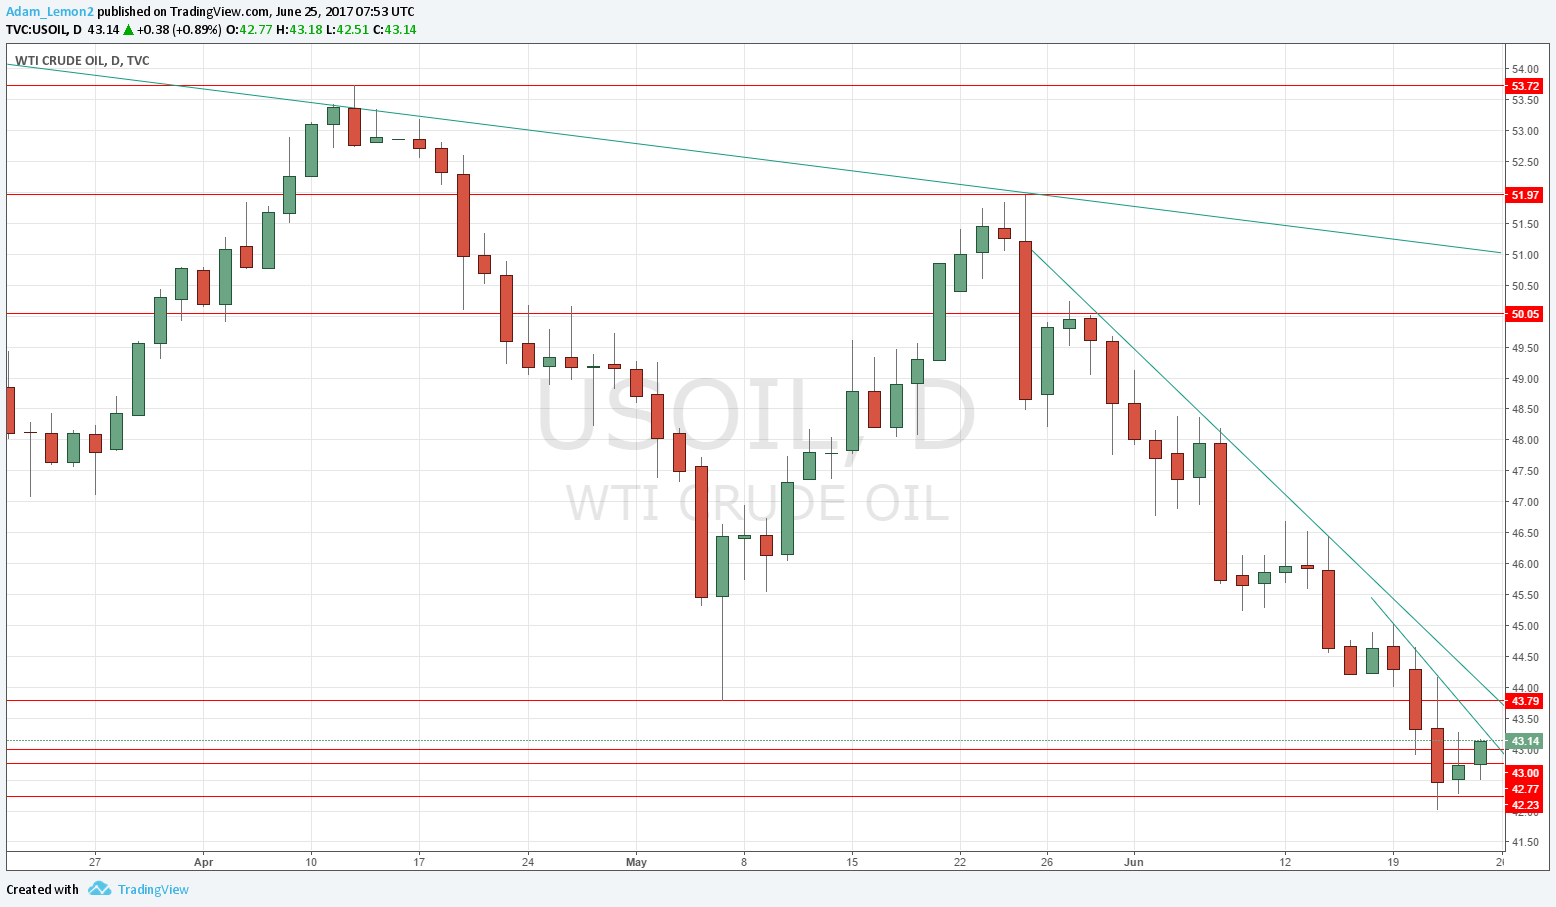
Crude Oil
After falling by about 20% in value over the past month, the pair has pierced but rejected a multi-month low price at $42.23. The price has risen from this low over the past couple of days. We may be close to a major bullish reversal from this low price, although the price must exceed $44.00 at least over the next 2 or 3 days before a reversal will begin to look safe for buyers, after such strong and heavy selling pressure.
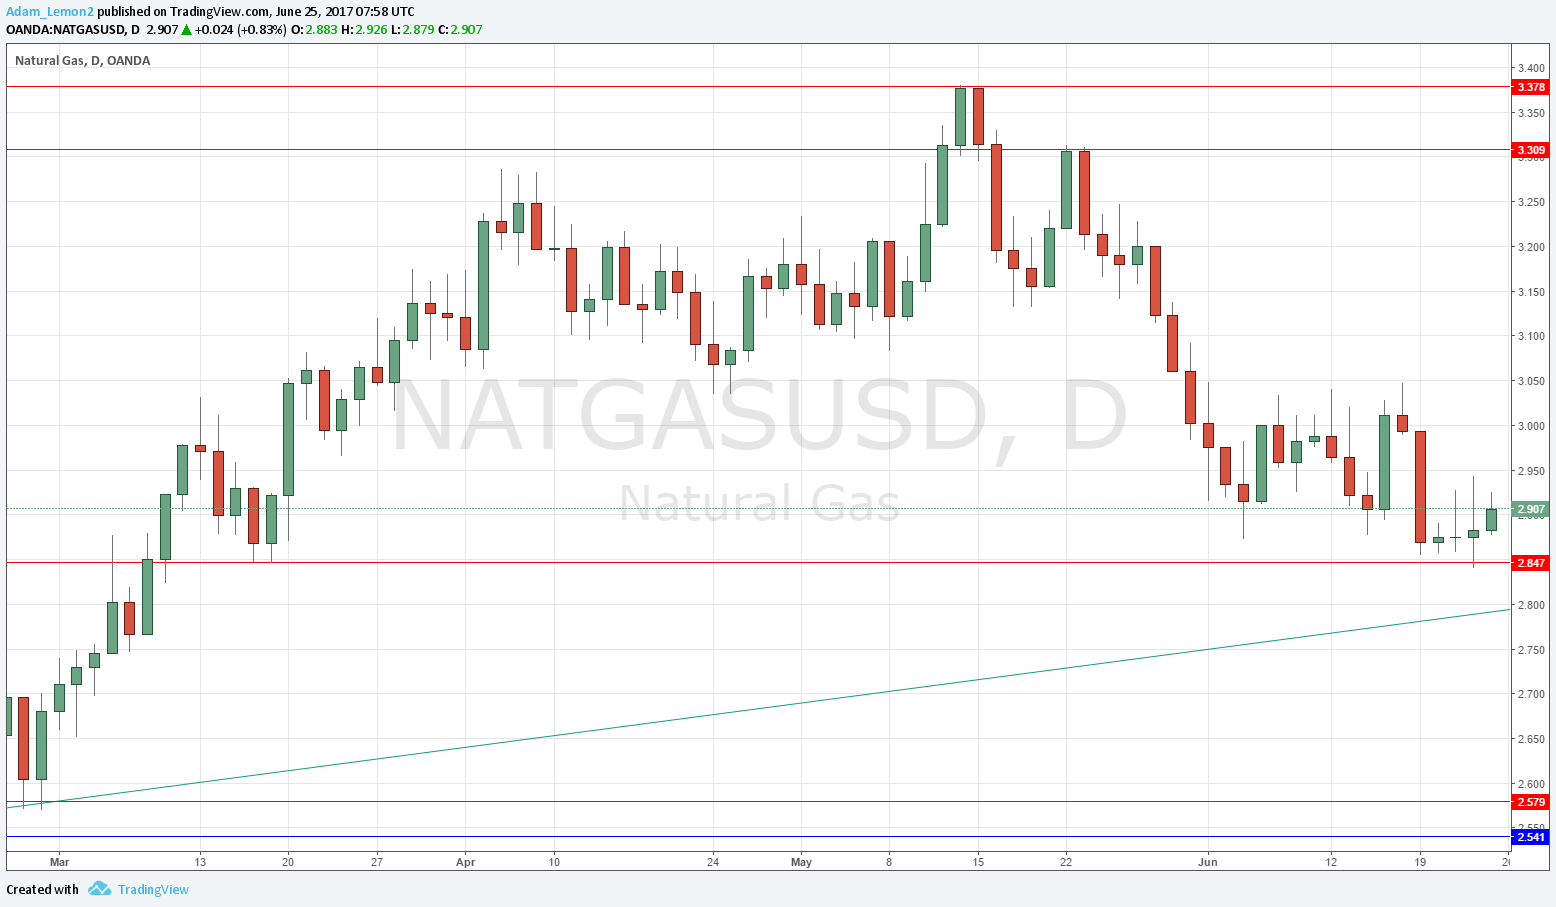
Natural Gas
It is not an accident that the other major energy asset of Natural Gas is also starting to look interesting as a potential buy at the same time as Crude Oil. A key swing low has finally been reached and rejected at $2.847. If the price will quickly break up above $2.95 within the first 2 days of the week, then it could be an interesting buy, although the level at $3.05 looks as if it could be resistant, blocking the way of a further rise.
Conclusion
Potentially bullish on Natural Gas and Crude Oil against the U.S. Dollar, with Natural Gas currently looking more attractive.


