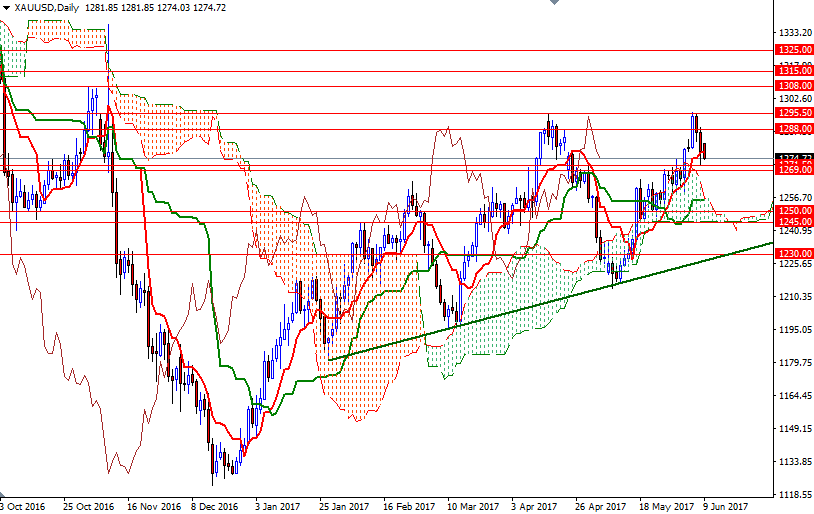
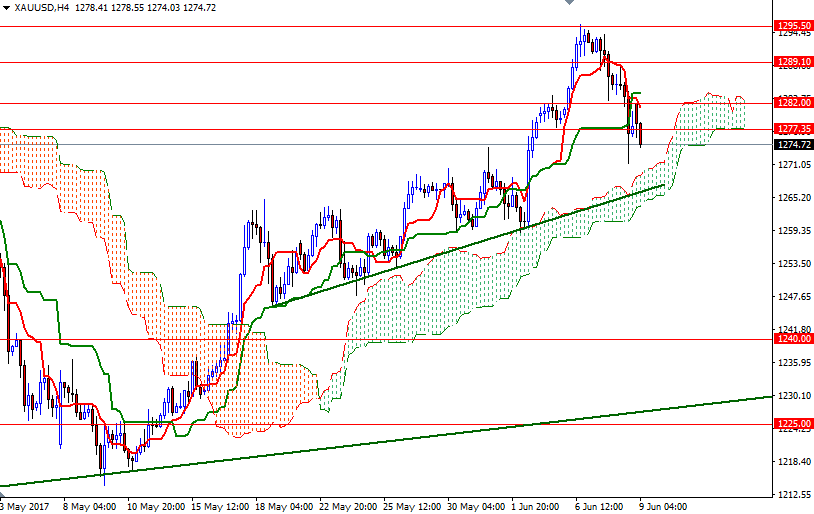
Gold prices fell 0.7% yesterday, extending their losses to a second straight session, as renewed strength in the U.S. dollar dampened demand for the precious metal. Technical selling was also behind the market’s decline yesterday. The XAU/USD pair initially tried to break up above the $1289.10-$1288 area, which I had identified as a key to $1295.50, but ultimately failed and breached a strategic support at $1282. As a result, gold traded as low as $1271.26 an ounce before recovering slightly.
Prices remain above the 4-hourly Ichimoku cloud but we have negatively aligned Tenkan-Sen (nine-period moving average, red line) - Kijun-Sen (twenty six-period moving average, green line) lines and the shorter-term (H1 and M30) charts are bearish at the moment. The shorter term charts indicate that a retest of 1271.50-1269 is likely unless prices climb back above the 1280-1277.35 area. A break down below 1269 could contribute further pressure on the market and open a path to the 1265.60-1263 zone, where the bottom of the 4-hourly cloud sits.
On the other hand, if XAU/USD get back above 1280, then we may test 1283.62/1282 area. The bulls will need to push prices beyond 1283.62, which also happens to be the Kijun-Sen on the H4 chart, so that they can find a chance to march towards 1289.10-1288. Closing above 1289.10 on a daily basis would be a positive signal and suggest that the market might make a fresh assault on 1295.50.


