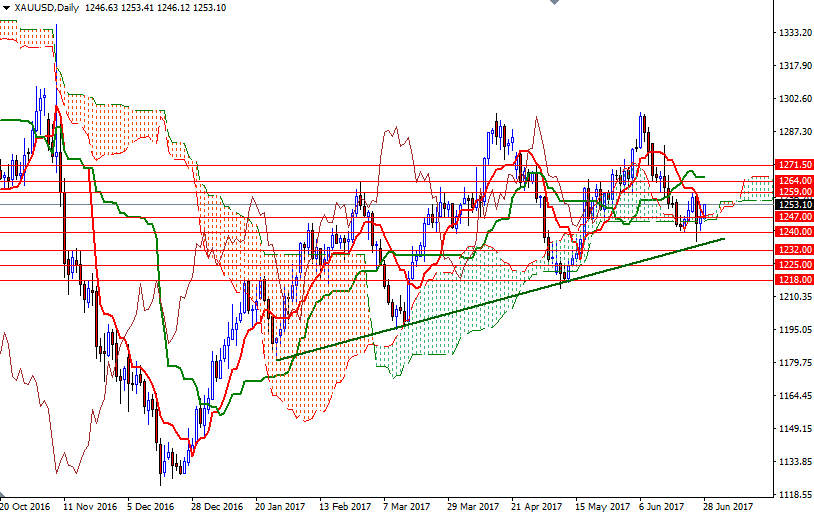
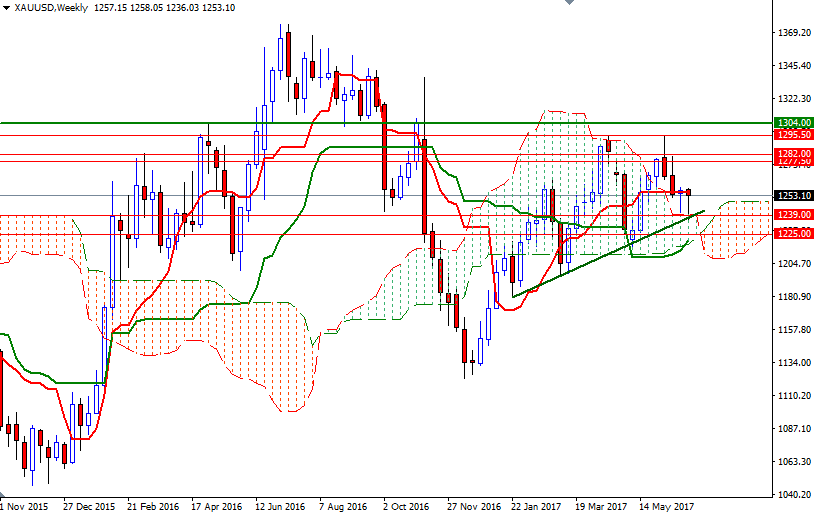
Gold prices rose $2.65 an ounce on Tuesday, moving away from a six-week low struck earlier this week, as a weaker dollar and losses in equity markets boosted the appeal of the precious metal as an alternative investment. The major U.S. stock indexes were lower yesterday, weighed down by declines in the shares of technology companies, while the U.S. dollar index fell after comments from European Central Bank President Mario Draghi lifted the euro. Gold is currently trading at $1253.10, higher than the opening price of $1246.63.
From a chart perspective, there are two things that catch my attention at first glance. First of all, the weekly Ichimoku cloud continues to act as a support. The weekly cloud occupies the area between 1239 and 1216 - plus, we have a medium-term bullish trend line in the same area. These suggest that the downside potential will be limited until XAU/USD breaks down below the 1232/0 zone at least. In order to challenge that support, the bears have to capture the strategic camp in the 1240/39 region.
The second thing to pay attention is that the market is trading within the borders of the 4-hourly cloud and the Tenkan-sen (nine-period moving average, red line) and the Kijun-sen (twenty six-period moving average, green line) are negatively aligned on the daily and the 4-hourly charts. The bulls will need to push prices above the 1260.50-1259 zone if they intend to take the reins and make an assault on the 1264 level.


