Start Trading Now Get Started
Table of Contents
Affiliate Disclosure
Affiliate Disclosure DailyForex.com adheres to strict guidelines to preserve editorial integrity to help you make decisions with confidence. Some of the reviews and content we feature on this site are supported by affiliate partnerships from which this website may receive money. This may impact how, where and which companies / services we review and write about. Our team of experts work to continually re-evaluate the reviews and information we provide on all the top Forex / CFD brokerages featured here. Our research focuses heavily on the broker’s custody of client deposits and the breadth of its client offering. Safety is evaluated by quality and length of the broker's track record, plus the scope of regulatory standing. Major factors in determining the quality of a broker’s offer include the cost of trading, the range of instruments available to trade, and general ease of use regarding execution and market information.

Gold Rise from 5-Week Lows - 22 June 2017

By Alp Kocak
Alp Kocak has been trading Forex since 2003. He writes technical analysis based on Japanese candlesticks and Ichimoku Kinko Hyo.

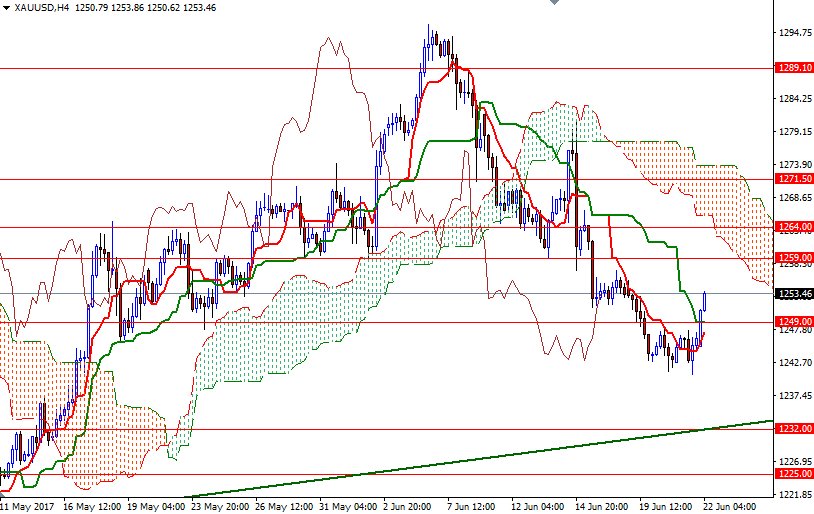
Gold prices ended Wednesday’s session up $3.82 an ounce, snapping a four-day losing streak, as a retreat in the dollar sparked some short-side profit taking. The XAU/USD pair has dropped nearly 4.1% since the market peaked at $1296. After testing the $1242-$1240 support zone for the second time yesterday, the precious metal has managed to break through the $1251-$1249 area in early Asian session today and reached the $1254 level as anticipated.

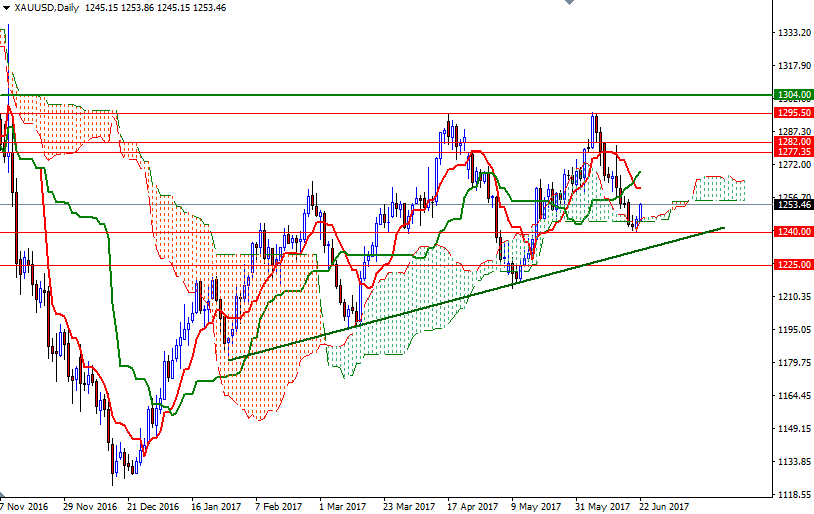
This reaction pushed prices above the Ichimoku cloud on the hourly chart but it seems that the market is stalling near the 1254 level, which represents the 23.6% retracement of the fall from 1296 to 1240.70. Although holding the initial key support above 1240 (the top of the weekly cloud) is a positive sign, prices are still below the cloud on the 4-hour chart, and XAU/USD has to penetrate 1254 in order to approach there. If the bulls are able to break through 1260/59, then 1262 and 1264 will be the next targets.

XAUUSD Daily

To the downside, keep an eye on the 1249/7 zone, where the the Tenkan-Sen (nine-period moving average, red line) and the Kijun-Sen (twenty six-period moving average, green line) are located on the H4 chart. If prices drop back below 1247, it is likely that we will revisit the 1242/0 area. A daily close below 1240 would encourage a sell-off towards 1232/0.

XAUUSD H4

Alp Kocak
Alp Kocak has been trading Forex since 2003. He writes technical analysis based on Japanese candlesticks and Ichimoku Kinko Hyo.

Most Visited Forex Broker Reviews