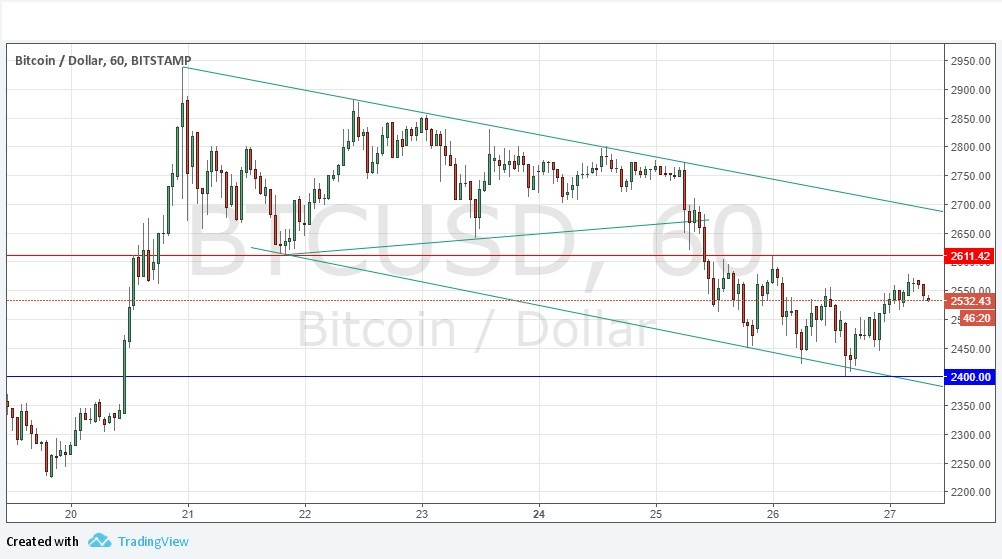
Yesterday’s signals produced a profitable long trade off the bullish candle break following the rejection of the support level at $2400. It would be wise to have closed the trade by now, as the upwards movement seems to have run out of steam and the price is within a bearish channel.
Today’s BTC/USD Signals
Risk 0.50% per trade.
Trades may only be entered before 5pm New York time today.
Long Trade 1
· Long entry after bullish price action on the H1 time frame following the next touch of $2400.00.
· Put the stop loss 1 pip below the local swing low.
· Move the stop loss to break even once the trade is $50 in profit by price.
· Remove 50% of the position as profit when the trade is 50 in profit by price and leave the remainder of the position to run.
Short Trade 1
· Short entry after bearish price action on the H1 time frame following the next touch of $2611.42.
· Put the stop loss 1 pip above the local swing high.
· Move the stop loss to break even once the trade is $50 in profit by price.
· Remove 50% of the position as profit when the trade is 50 in profit by price and leave the remainder of the position to run.
The best method to identify a classic “price action reversal” is for an hourly candle to close, such as a pin bar, a doji, an outside or even just an engulfing candle with a higher close. You can exploit these levels or zones by watching the price action that occurs at the given levels.
BTC/USD Analysis
Yesterday saw the support level at $2400.00 hold nicely, producing a good, profitable long trade following the inside candle break. However, the price is established within a bearish channel which has clear boundaries and is symmetrical, suggesting it is likely to hold. I see the upper level as more likely to be strong and to produce the next good trade from support or resistance. Before that price could be reached, there is horizontal resistance at $2611.42 which looks strong and an attractive point at which to seek a short trade entry.
Despite the medium-term bearish picture, there is still residual long-term bullishness, so an eventual move up to new highs remains a possibility, if $2611.42 can be overcome. On a longer-term scale, the bearish channel could be interpreted as a flag within an upwards move.
Regarding the USD, there will be releases of Core Durable Goods Orders and Unemployment Claims data at 1:30pm London time.

