Today’s BTC/USD Signals
Risk 0.50% per trade.
Trades must be taken before 5pm New York time today only.
Long Trade 1
- Go long after bullish price action on the H1 time frame following the next touch of $2643.45.
- Place the stop loss 1 pip below the local swing low.
- Adjust the stop loss to break even once the trade is $50 in profit by price.
- Take off 50% of the position as profit when the trade is 50 in profit by price and leave the remainder of the position to ride.
The best method to identify a classic “price action reversal” is for an hourly candle to close, such as a pin bar, a doji, an outside or even just an engulfing candle with a higher close. You can exploit these levels or zones by watching the price action that occurs at the given levels.
BTC/USD Analysis
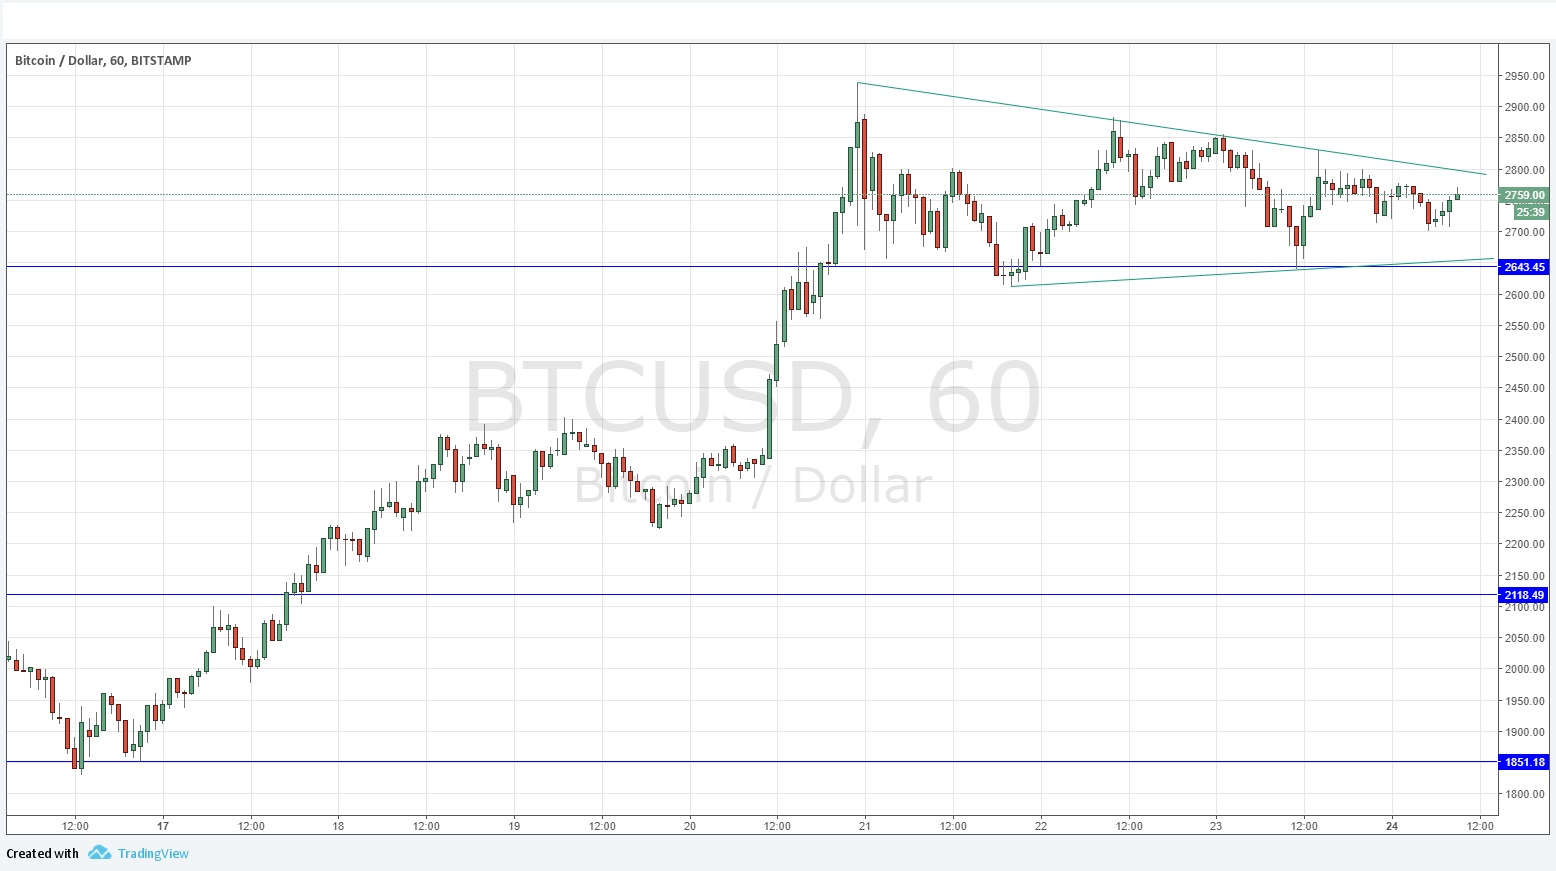
The price has been in a rare (for bitcoin) consolidation pattern resembling a triangle for the past few days. As we are in a wildly strong long-term upwards trend, and as the triangle is bounded below by an obvious key support level at $2643.45, it is more likely that we will see higher prices before we get significantly lower prices. However, it is quite possible that the consolidation pattern will continue until the major USD-related FOMC releases due during Wednesday’s New York session.
I would be reluctant to trade a rejection of the upper trend line of the triangle shown in the chart below, but a bullish rejection of the lower trend line could produce a good opportunity to go long even if the price does not touch the key support at $2643.45. The decline in volatility we have been experiencing over recent days could be helpful in that it can give a relatively low-risk entry when the set-up does come.
There is nothing due today concerning the USD.
