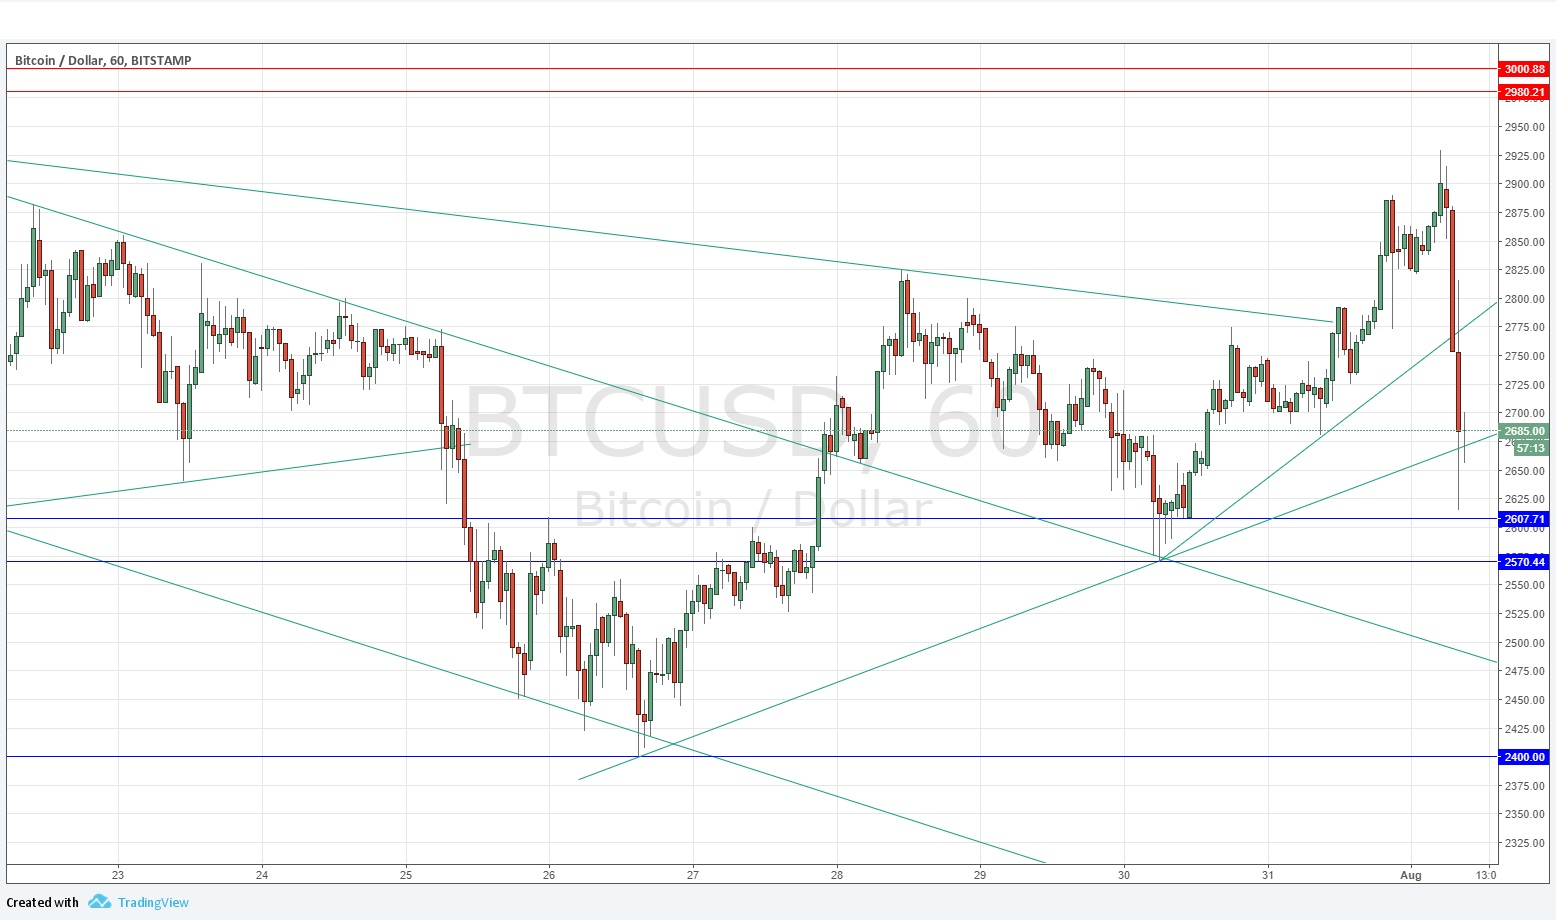
Yesterday’s signals were not triggered as the price never reached the key level.
Today’s BTC/USD Signals
Risk 0.50% per trade.
Trades may only be entered by 5pm New York time today.
Be extremely cautious taking ANY trade today.
Long Trades
- Go long after bullish price action on the H1 time frame following the next touch of $2607.71, $2570.44, or $2400.00.
- Put the stop loss 1 pip below the local swing low.
- Move the stop loss to break even once the trade is $50 in profit by price.
- Remove 50% of the position as profit when the trade is 50 in profit by price and leave the remainder of the position to run.
Short Trades
- Go short after bearish price action on the H1 time frame following the next touch of $2800.00, or $3000.00.
- Put the stop loss 1 pip above the local swing high.
- Move the stop loss to break even once the trade is $50 in profit by price.
- Remove 50% of the position as profit when the trade is 50 in profit by price and leave the remainder of the position to run.
The best method to identify a classic “price action reversal” is for an hourly candle to close, such as a pin bar, a doji, an outside or even just an engulfing candle with a higher close. You can exploit these levels or zones by watching the price action that occurs at the given levels.
BTC/USD Analysis
There are wild scenes in the Bitcoin market as the community is splitting, meaning some bitcoins won’t be convertible into other bitcoins. There will effectively be two different bitcoins. This has caused enormous, volatile moves in the Bitcoin market, so it might be better to stand aside for a while.
The bullish upwards move continued yesterday with increasing strength, as can be seen in the chart below by the series of steepening supportive trend lines. However, the price has now broken forcefully below the first trend line, suggesting that a deep bearish pull back is now likely to take place over the coming hours. At the time of writing, the downwards movement is extremely strong, with very high volatility. The price may well reach the nearest support levels around $2600.00 and this will be a test of the underlying bullishness. If the price gets below $2570.00 it will be a very bearish sign, while a break below $2400.00 would probably trigger some panic selling and possibly a major collapse in the price.
Today is a good example of how trading Bitcoin can be extremely risky.
Regarding the USD, there will be a release of ISM Manufacturing PMI data at 3pm London time.
