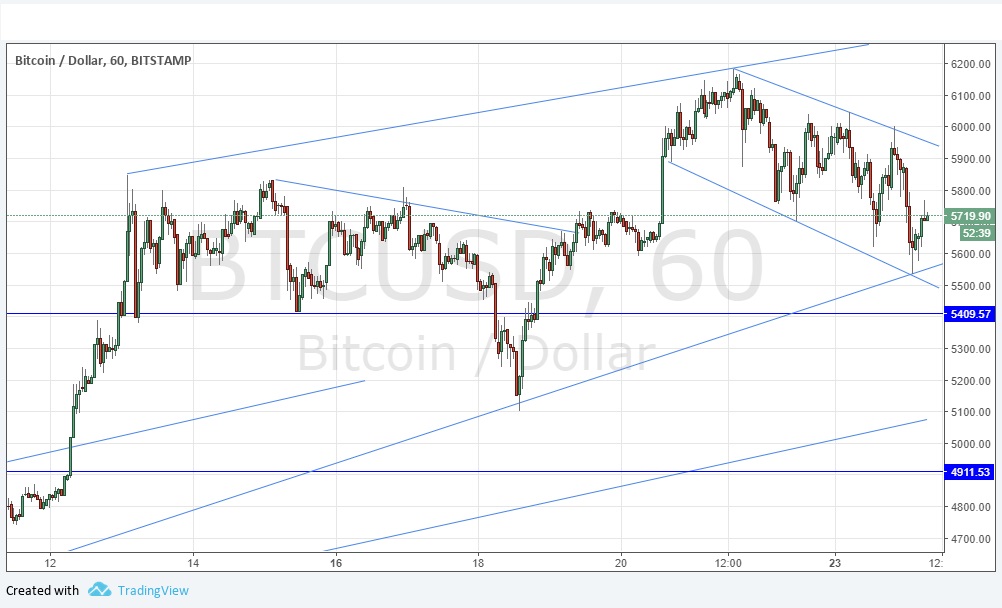
Yesterday’s signals were not triggered, as there was no bullish price action when the price reached the anticipated support zone between $5754.79 and $5731.18.
Today’s BTC/USD Signals
Risk 0.75% per trade.
Trades may only be entered until 5pm New York time today.
Long Trades
· Long entry after a bullish price action reversal on the H1 time frame following the next touch of $5409.57 or $4911.53.
· Place the stop loss 1 pip below the local swing low.
· Move the stop loss to break even once the trade is $50 in profit by price.
· Take off 50% of the position as profit when the trade is $50 in profit by price and leave the remainder of the position to ride.
The best method to identify a classic “price action reversal” is for an hourly candle to close, such as a pin bar, a doji, an outside or even just an engulfing candle with a higher close. You can exploit these levels or zones by watching the price action that occurs at the given levels.
BTC/USD Analysis
I wrote yesterday that I was keeping a bullish bias, and I maintain that position although the picture is more bearish today. I would need to see more downwards movement than this to start looking for short trades. We have seen the former support zone break down and become invalidated. That chart below shows that the price is within a long-term bullish channel, but a short-term downwards channel. This can be a useful formation if the short-term channel breaks in the direction of the long-term channel, signifying an appropriate time to seek long trade entries. However, the technical picture is complicated more by the fact that the price has again just touched a supportive long-term bullish trend line, so there may already be an attractive long in play. It looks like a good idea to look for long trades at bullish bounces on trend lines or at the next key horizontal level of $5409.57.
There is nothing important due today regarding the USD.


