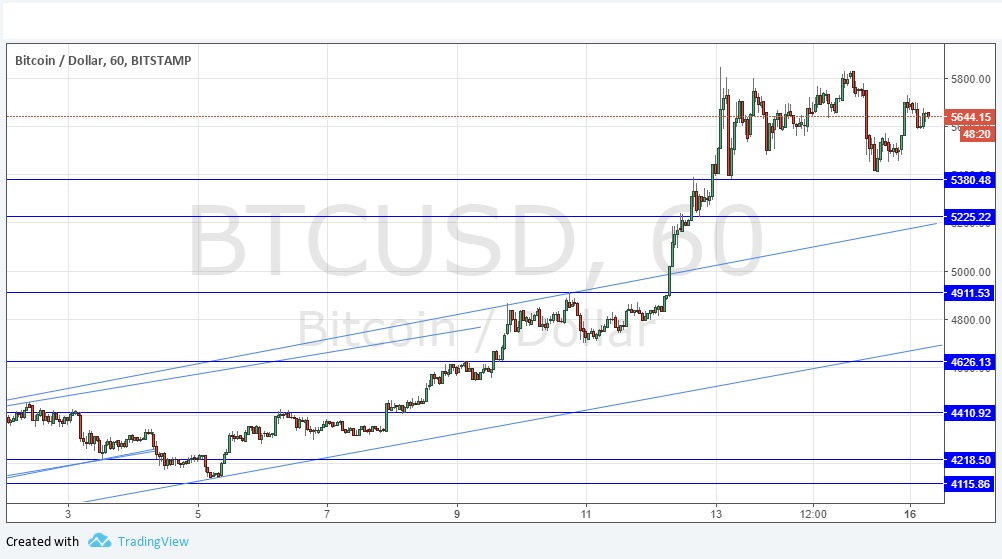
Last Wednesday’s signals were not triggered, as none of the key levels were ever reached during that day’s session.
Today’s BTC/USD Signals
Risk 0.75% per trade.
Trades must be taken before 5pm New York time today only.
Long Trades
Go long after a bullish price action reversal on the H1 time frame following the next touch of $5380.48, $5225.22, or $4911.53.
Put the stop loss 1 pip below the local swing low.
Adjust the stop loss to break even once the trade is $50 in profit by price.
Remove 50% of the position as profit when the trade is $50 in profit by price and leave the remainder of the position to run.
The best method to identify a classic “price action reversal” is for an hourly candle to close, such as a pin bar, a doji, an outside or even just an engulfing candle with a higher close. You can exploit these levels or zones by watching the price action that occurs at the given levels.
BTC/USD Analysis
The picture is even more bullish now that it was in my previous analysis last Wednesday. On Thursday we saw an extremely strong bullish breakout move, with the price bursting out of the top of the bullish price channel (still shown in the chart below) and breaking the psychologically significant $5000.00 price level for the first time ever, going on to make new all-time highs and increasing in value by about 15% until a new high price of $5846 was made. Since then, the price has been in a process of consolidation, failing to break that new all-time high price, but also not reaching the new supportive level at $5380.48.
It is quite possible the price will continue to consolidate for a while before making a new all-time high price, but it definitely makes sense to maintain a bullish bias and look for long trade opportunities. There are no obvious places to find a high probability short trade, so no shorts today.
There is nothing significant due today concerning the USD.

