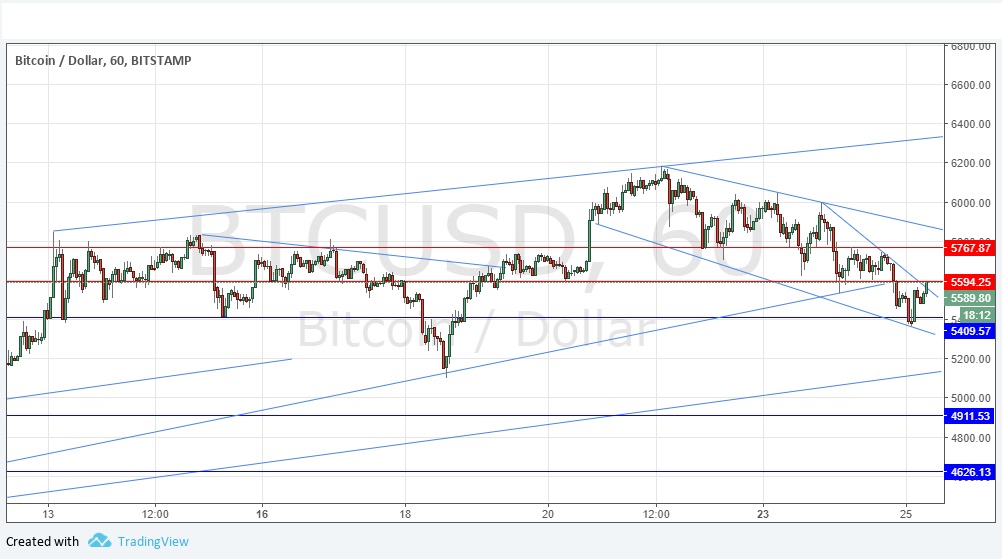
Yesterday’s signals were not triggered, as the price did not reach $5409.57 until after the end of the specified time session.
Today’s BTC/USD Signals
Risk 0.75% per trade.
Trades must be taken before 5pm New York time today.
Long Trades
Go long after a bullish price action reversal on the H1 time frame following the next touch of $5409.57, the lowest bullish trend line shown in the chart below, or $4911.53.
Put the stop loss 1 pip below the local swing low.
Adjust the stop loss to break even once the trade is $200 in profit by price.
Remove 50% of the position as profit when the trade is $200 in profit by price and leave the remainder of the position to run.
Short Trade 1
Go short after a strongly bearish price action reversal on the H1 time frame if there is a simultaneous touch of $5767.87, and the bearish trend line currently sitting at about $5864.00.
Put the stop loss 1 pip above the local swing high.
Adjust the stop loss to break even once the trade is $200 in profit by price.
Remove 50% of the position as profit when the trade is $200 in profit by price and leave the remainder of the position to run.
The best method to identify a classic “price action reversal” is for an hourly candle to close, such as a pin bar, a doji, an outside or even just an engulfing candle with a higher close. You can exploit these levels or zones by watching the price action that occurs at the given levels.
BTC/USD Analysis
I wrote yesterday that I was keeping a bullish bias, but that the picture was becoming more bearish, and that I would need to see more downwards movement than this to start looking for short trades.
We have now seen such downwards movement, although the support level at $5409.57 has effectively held. However, the price is now in a short-term bearish channel, and has printed two new resistance levels on its journey down. At the time of writing, the price is testing the lower one at $5594.25, so it is not appropriate to forecast a short trade entry. A strong bearish rejection of the resistance confluence at $5767.87 and the bearish trend line looks much more attractive. If the price breaks above that structure and stays there, the picture will look very bullish again, but if the price breaks below $5400.00 it will probably continue down to $5200.00 and possibly lower still.
I am still more enthusiastic about long trades than short trades, and suggest being quicker to take any profits on good short trades, and being more comfortable to let long trades run.
Regarding the USD, there will be a release of Core Durable Goods Orders at 1:30pm London time, followed by Crude Oil Inventories at 3pm.


