The difference between success and failure in Forex trading is very likely to depend upon which currency pairs you choose to trade each week, and not on the exact trading methods you might use to determine trade entries and exits. Each week I am going to analyze fundamentals, sentiment and technical positions in order to determine which currency pairs are most likely to produce the easiest and most profitable trading opportunities over the next week. In some cases it will be trading the trend. In other cases it will be trading support and resistance levels during more ranging markets.
Big Picture 22nd October 2017
Last week, I saw the best possible trades for the coming week as long GBP/USD, and long of the S&P 500 Index in U.S. Dollars. The overall result was positive, as although the GBP/USD fell by 0.70%, the S&P 500 Index rose by 0.83%, producing a small average win of 0.06%.
The Forex market over the past week has reversed and moved back in favor of the U.S. Dollar again, against the long-term bearish trend in the greenback. The news was dominated by the U.S. Senate’s approval of a budget vehicle for tax cuts planned by the Trump administration, which was very positive for the U.S. Dollar and for the U.S. stock market also.
The news agenda this week is almost certainly going to be dominated by U.S. GDP data due Friday, as well as central bank input from the European Central Bank and the Bank of Canada.
The American stock market is still making new all-time highs which is always a bullish sign.
Following the current picture, I see the highest probability trades this week as long of the U.S. Dollar against the Japanese Yen and New Zealand Dollar, and long of the S&P 500 in U.S. Dollar terms.
Fundamental Analysis & Market Sentiment
Sentiment is currently more bullish on the U.S. Dollar and stocks following a more positive outlook concerning the potential success of President Trump’s tax cut plan. As there are no major releases scheduled until Wednesday, this mood is likely to continue until that day at least. There is an election in Japan today, and it seems clear that the current administration will be returned, so this is unlikely to have a significant impact upon the Japanese Yen.
Sentiment has been very bearish on the New Zealand Dollar following the result of coalition negotiations, which has produced a Labour coalition.
Technical Analysis
U.S. Dollar Index
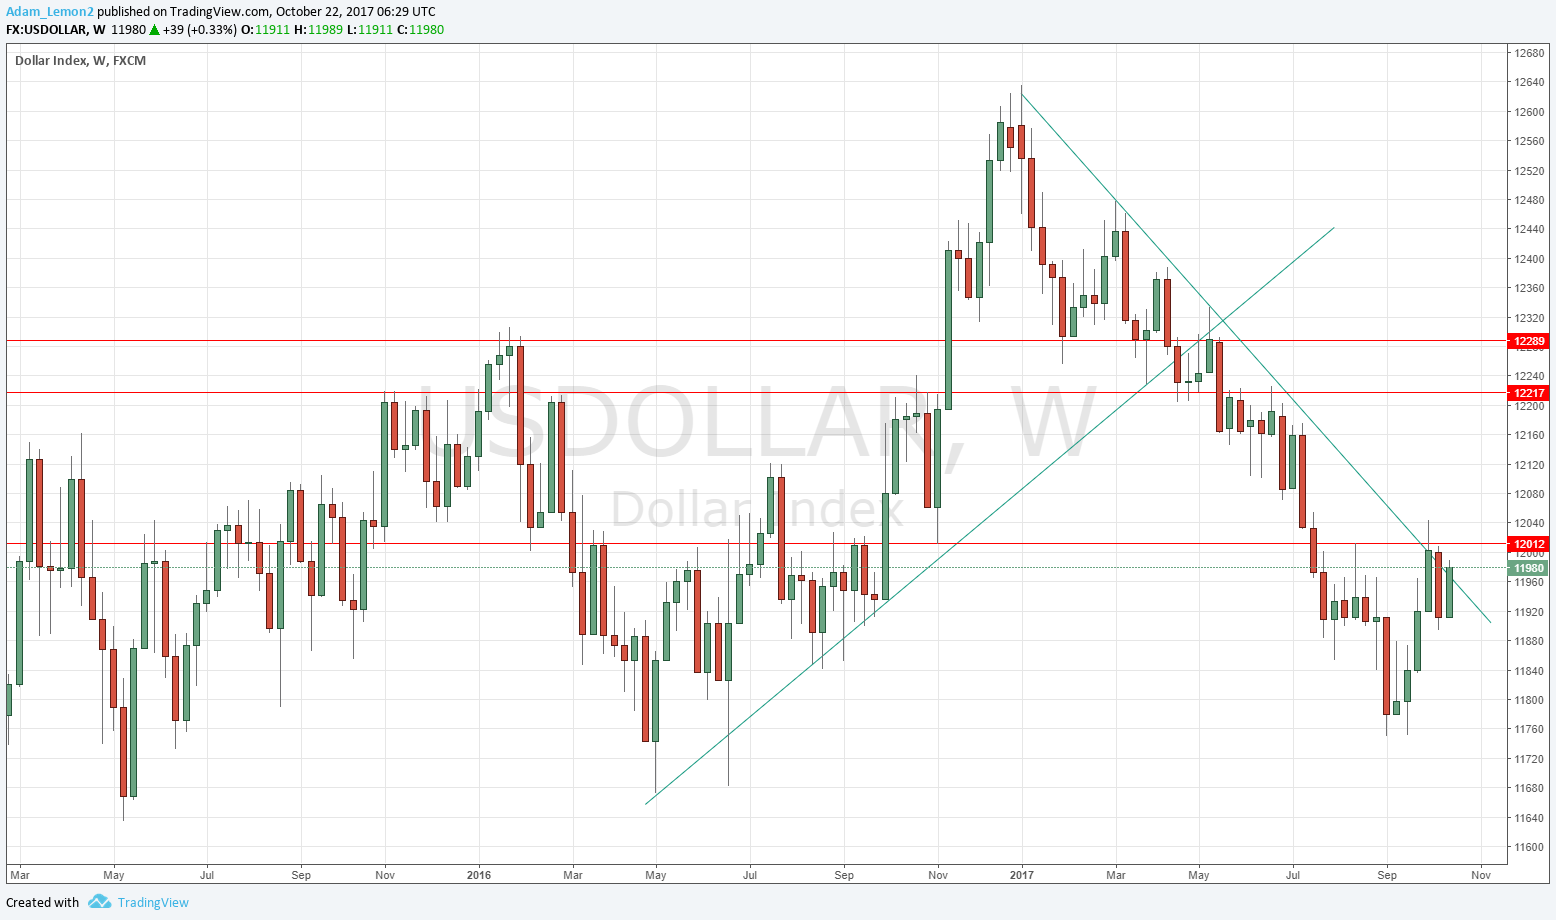
This pair printed a reasonably large bullish inside candlestick, challenging the long-term bearish trend line shown in the chart below. The close was very close to the high, and the close is above the price from 13 weeks ago, technically invalidating the long-term bearish trend in the greenback. The resistance level at 12012 looks likely to come under pressure soon. Another bullish week next week would be a significant development and possibly signal the start of a new long-term bullish trend, or more probably, a period of consolidation and uncertainty following the end of the recent bearish trend.
USD/JPY
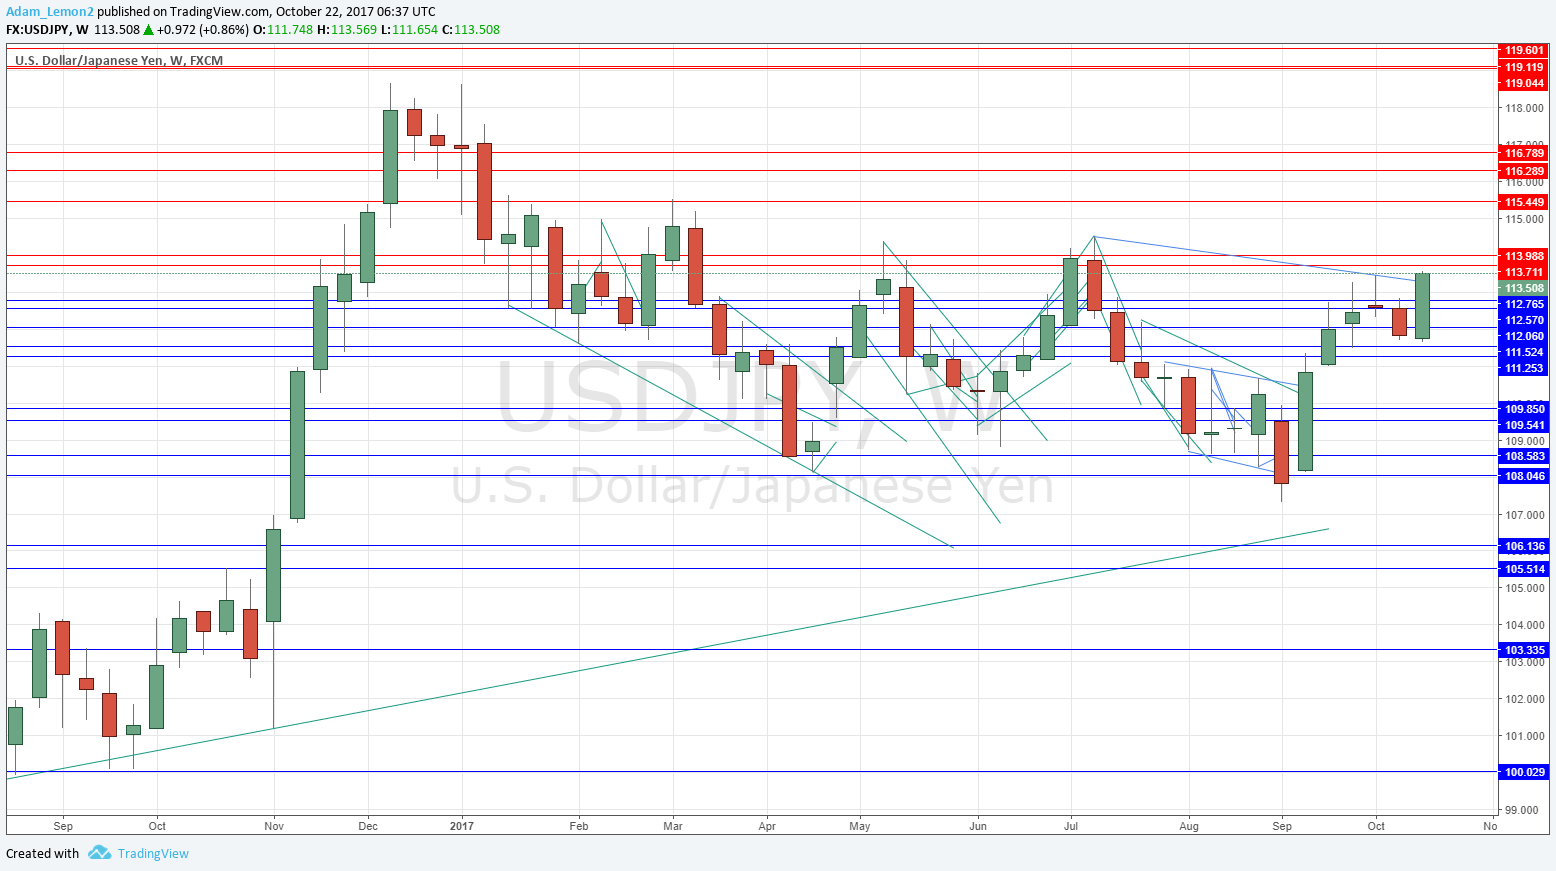
Although the volatility remains quite low, this pair is starting to look interesting as it breaks out from some ranges it has been stuck within over a lengthy period. The weekly candle closed right on its high, above the area of resistance just below 113.00. It is the highest close in the last 14 weeks, and the price is now above its former levels from 3 months and 6 months ago respectively. The signs are bullish, but as the directional action over several months is broadly flat, I am a little cautious.
NZD/USD
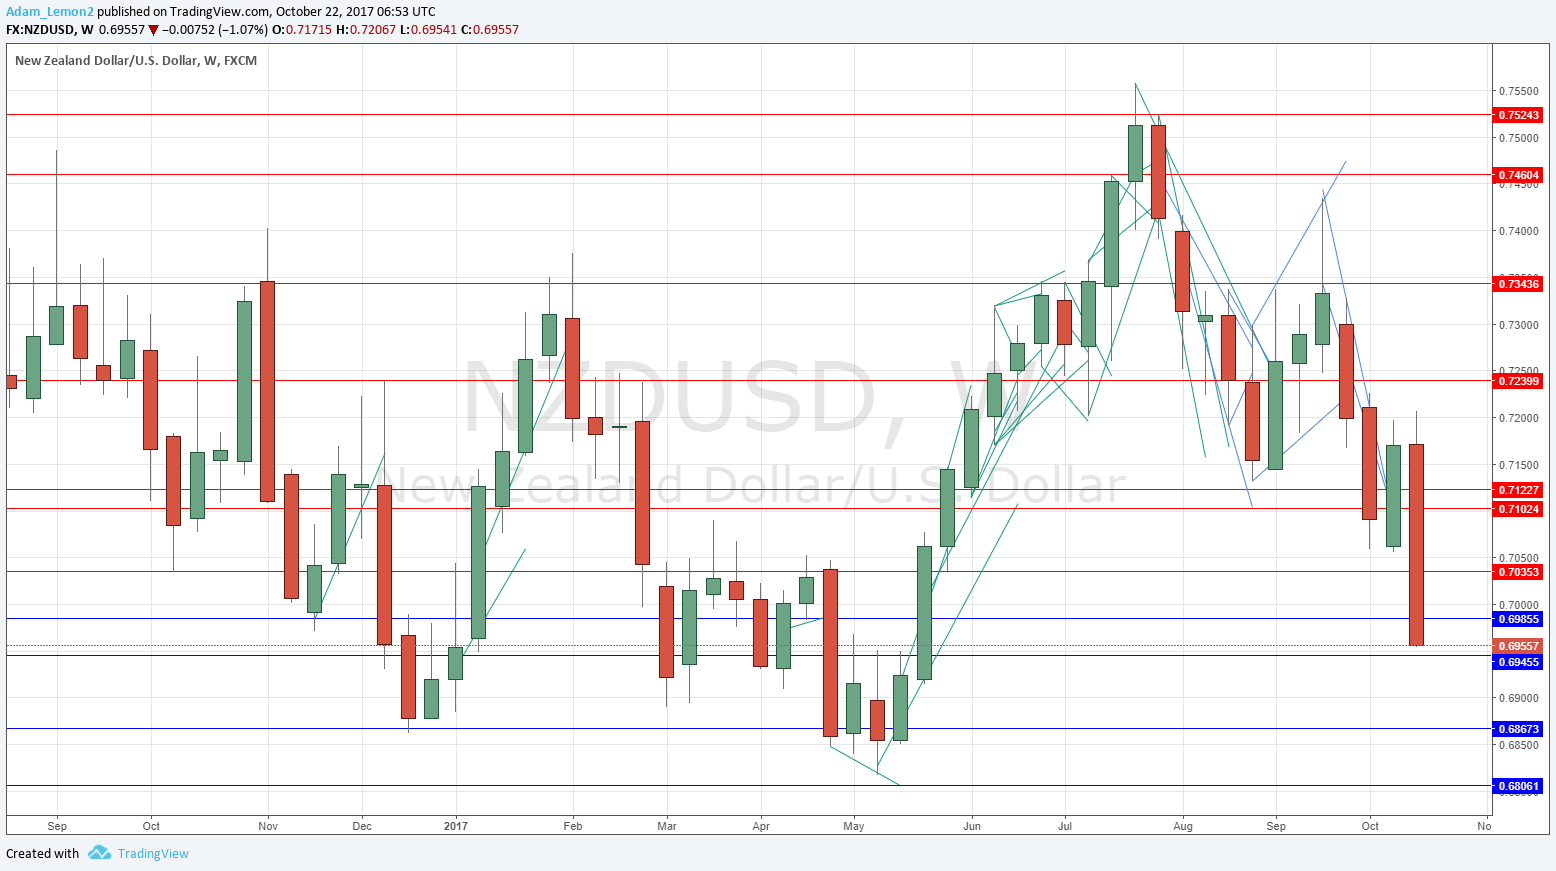
The volatility in this pair has been very high, and the trend over recent weeks is unquestionably bearish. However, it can be seen in the chart below that the price is swinging and running rather than truly trending over the long-term. There is an inflective point not far below which could hold the price as support if it is reached. This area of potential support starts at about 0.6850. Overall, the bearish momentum in the NZD is so strong that it looks as if it will continue for at least a little while.
S&P 500
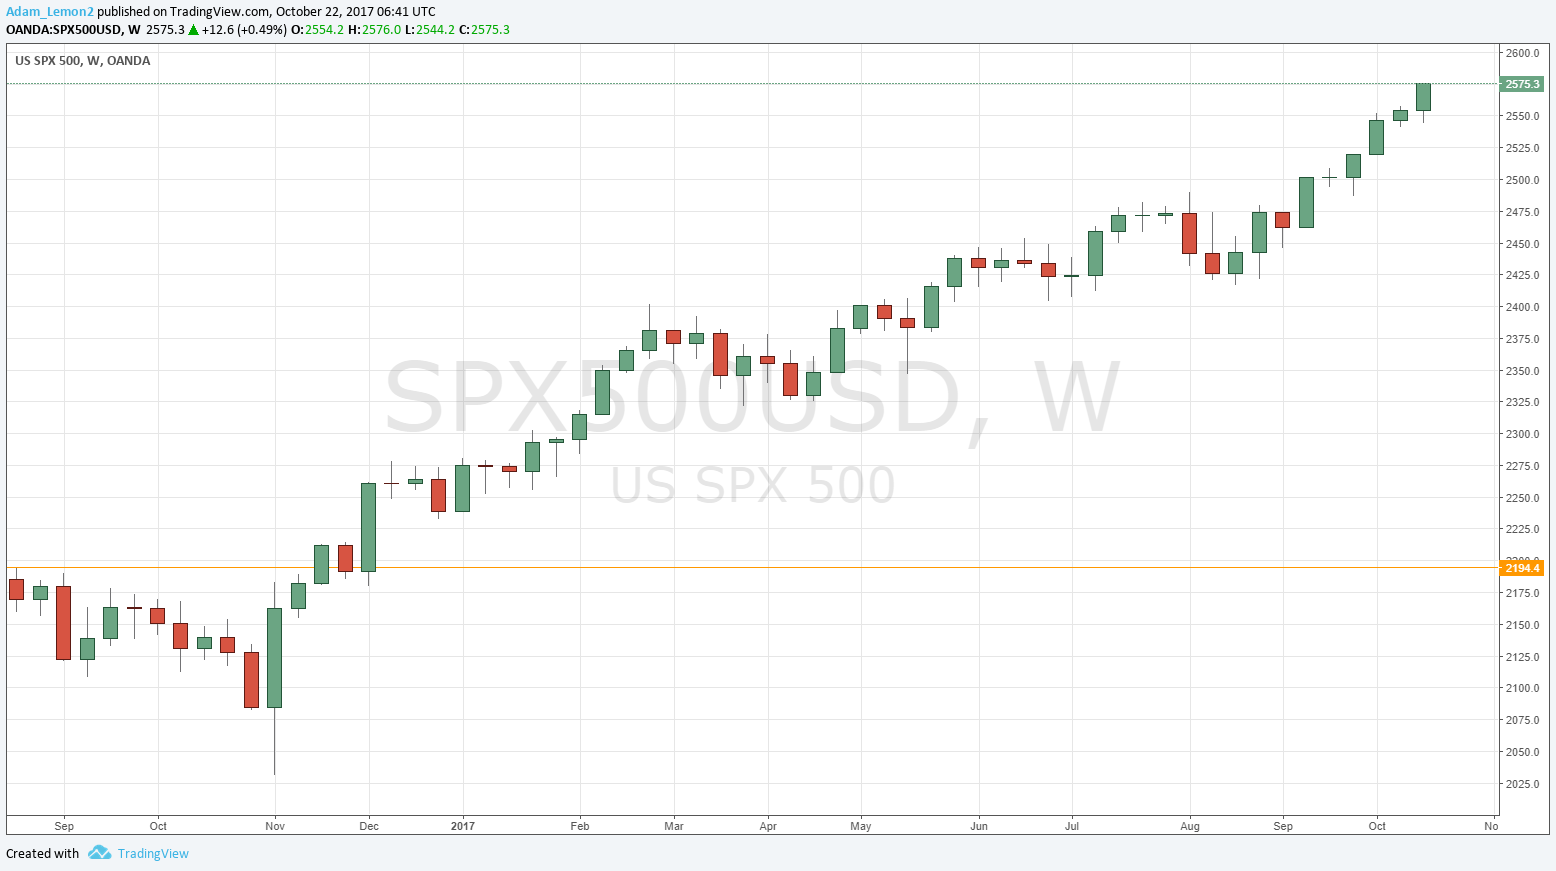
We again see new all-time highs here, and the chart below shows just how steadily bullish the trend has been. There is every reason to continue to be bullish despite the endless articles in the press forecasting an imminent market crash. This talk has been going on for months while the market just keeps going up and up, albeit on very low volatility. Trade what you see, not what the papers say, and what we see here is a strongly bullish market.
Conclusion
Bullish on the U.S. Dollar, and the S&P 500; bearish on the New Zealand Dollar and Japanese Yen.


