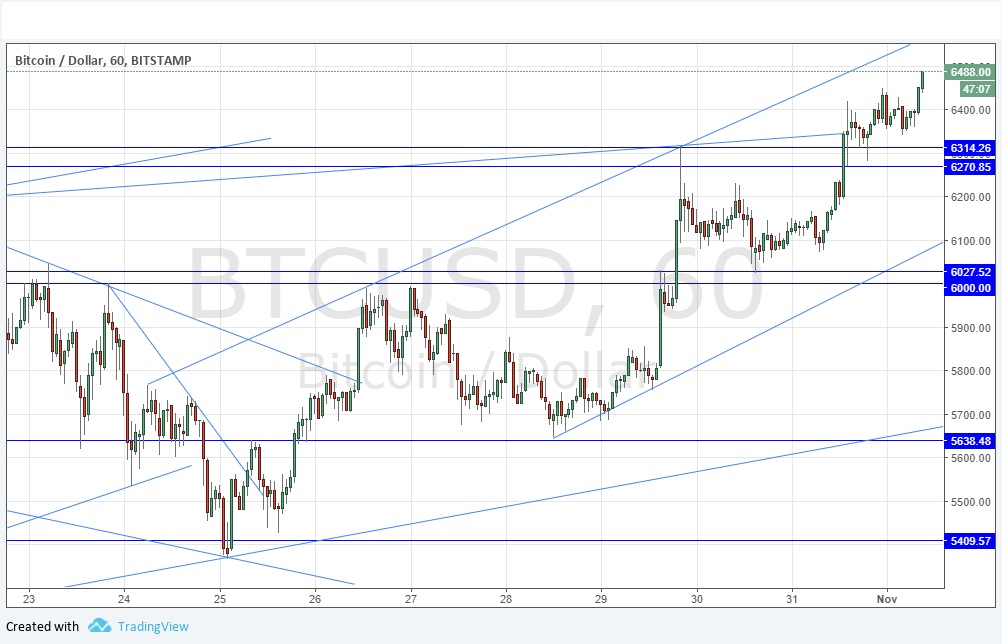
Yesterday’s signals were not triggered, as the price never reached $6027.50.
Today’s BTC/USD Signals
Risk 0.75% per trade.
Trades taken before 5pm New York time today only.
Long Trades
Go long after a bullish price action reversal on the H1 time frame following the next entry into the zone between $6314.26 and $6270.85, or into the zone between $6027.52 and $6000.00.
Put the stop loss 1 pip below the local swing low.
Adjust the stop loss to break even once the trade is $200 in profit by price.
Remove 50% of the position as profit when the trade is $200 in profit by price and leave the remainder of the position to run.
The best method to identify a classic “price action reversal” is for an hourly candle to close, such as a pin bar, a doji, an outside or even just an engulfing candle with a higher close. You can exploit these levels or zones by watching the price action that occurs at the given levels.
BTC/USD Analysis
Yesterday, I wrote that I maintain a bullish bias and Bitcoin continues to give fantastic long trading opportunities. I have the same opinion today, and I hold it even more strongly, as Bitcoin is making new all-time highs very close to $6500.00 at the time of writing. All-time highs in something hot and new like Bitcoin are usually followed by further price rises, so I expect still higher prices. How far this upwards leg will travel is anyone’s guess, although there is some potential technical resistance not too far away. The chart below shows the price is contained within a clear bullish price channel with an upper trend line boundary at about $6560.00. On the other side, the price action has established a new, higher zone of probable support at $6314.26.
I say again, that I maintain a bullish bias and Bitcoin continues to give fantastic long trading opportunities.
Regarding the USD, there will be a release of the ADP Non-Farm Employment Change at 1:15pm London time, followed by ISM Manufacturing PMI data at 3pm, Crude Oil Inventories at 3:30pm, and the FOMC Statement at 7pm.
