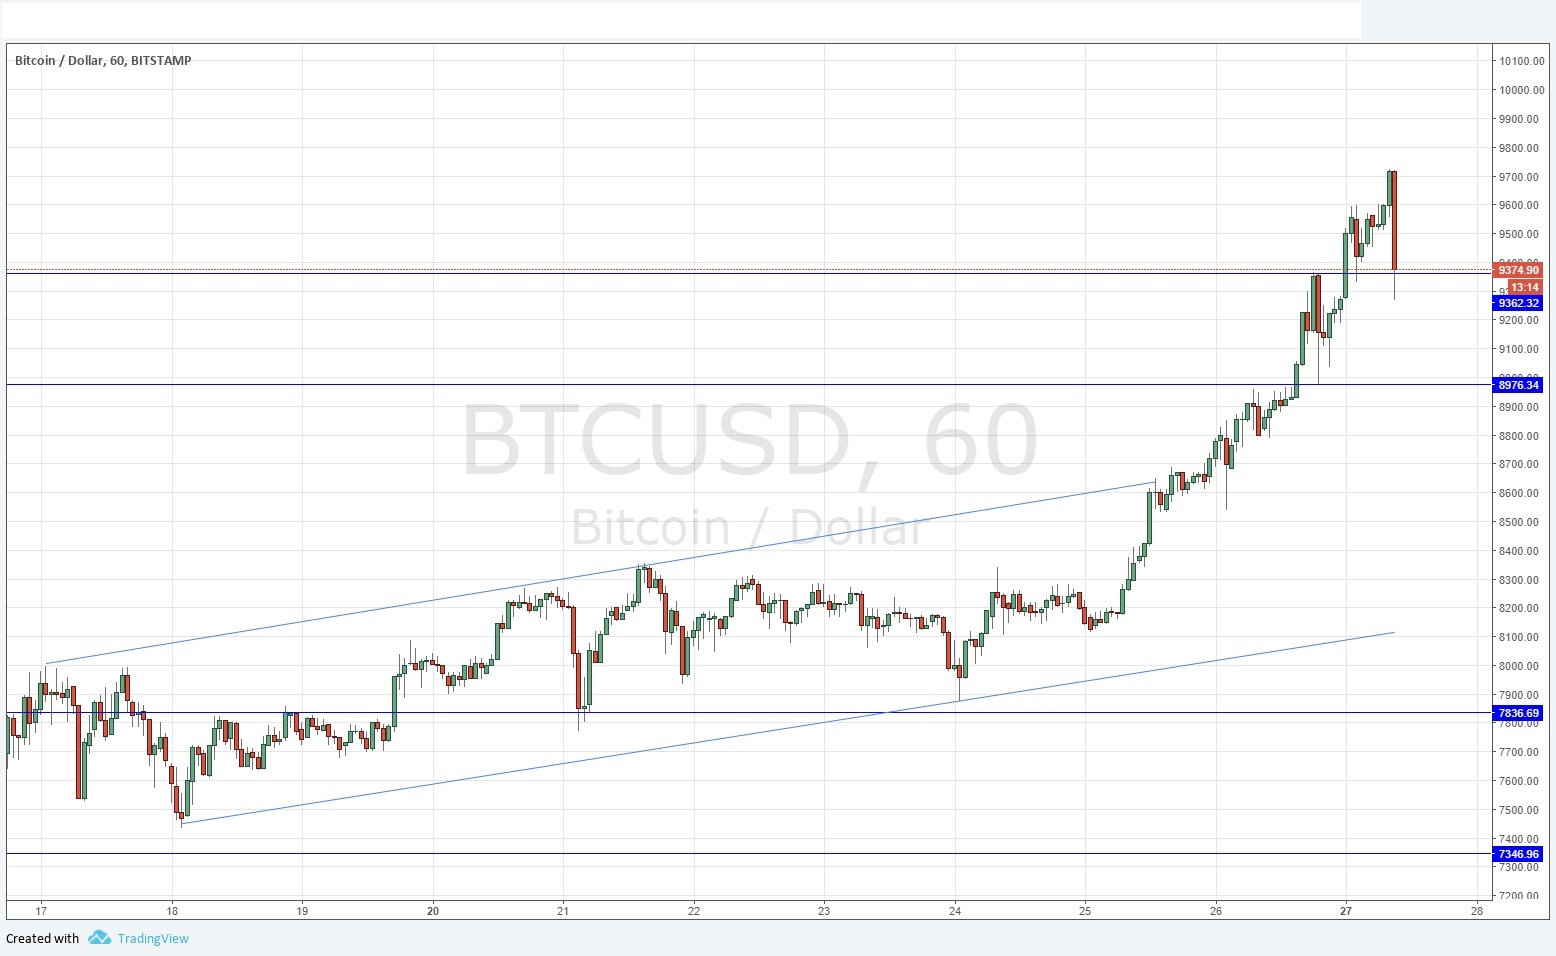
Last Thursday’s signals were not triggered, as none of the key levels were ever reached.
Today’s BTC/USD Signals
Risk 1.00% per trade.
Trades may only be entered before 5pm New York time today.
Long Trades
Long entry after a bullish price action reversal on the H1 time frame following the next touch of $9362.32, $8976.34, or $7836.62.
Place the stop loss 1 pip below the local swing low.
Move the stop loss to break even once the trade is $200 in profit by price.
Take off 50% of the position as profit when the trade is $200 in profit by price and leave the remainder of the position to ride.
The best method to identify a classic “price action reversal” is for an hourly candle to close, such as a pin bar, a doji, an outside or even just an engulfing candle with a higher close. You can exploit these levels or zones by watching the price action that occurs at the given levels.
BTC/USD Analysis
Last Thursday I was still maintaining a bullish bias even though it was starting to look as though the upwards movement was slowing down considerably. Although the short-term trend was running out of steam, I pointed to the support level as crucial – it was not even touched, and the price went on to make a strong bullish breakout and rise by more than $1000 to touch a new all-time high just below $9750.00. Along the way, two new levels were flipped from short-term resistance to become probable support, at $8976.00 and $9362.32.
The number one issue today is how close the price is to the psychologically huge price of $10,000. If the price is reached, we can expect a big reaction, either a sharp move down or a drive even higher on increasing momentum. This is typical when a hot new stock reaches such a significant number, and it is appropriate to compare Bitcoin to a hot new stock. At the time of writing, the price got to just short of $9750.00 and then had its strongest fall within an hour for about three weeks.
The key thing to watch now is whether there is follow-through on this move down. If the price recovers and volatility calms down, a push up to $10,000 becomes the more likely scenario. If the price breaks below the support at $8976.34, that will be a very bearish sign that a big profit-taking sell-off is underway, and the price would be likely to fall even further. If there is no hourly close below $9362.32, that will be a bullish sign.
I think a bullish outcome is more likely, but the price needs to be watched very carefully as today could easily see a long-term high price. Another scenario would be wild, untradeable volatility swinging up and down under $10,000 – if this happens, it would be best to stand aside.
There is nothing important due today concerning the USD.

