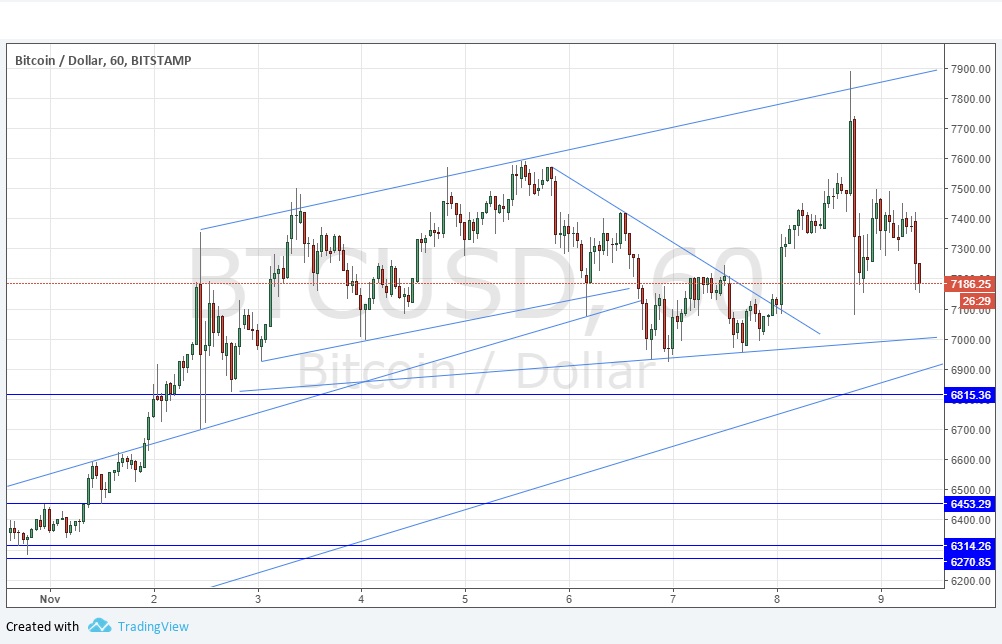
Yesterday’s signals were not triggered, as there was insufficiently bearish price action at $7475.80.
Today’s BTC/USD Signals
Risk 0.75% per trade.
Trades may only be entered until 5pm New York time today.
Long Trade 1
Go long after a bullish price action reversal on the H1 time frame following the next touch of $6815.36.
Place the stop loss 1 pip below the local swing low.
Move the stop loss to break even once the trade is $200 in profit by price.
Take off 50% of the position as profit when the trade is $200 in profit by price and leave the remainder of the position to ride.
The best method to identify a classic “price action reversal” is for an hourly candle to close, such as a pin bar, a doji, an outside or even just an engulfing candle with a higher close. You can exploit these levels or zones by watching the price action that occurs at the given levels.
BTC/USD Analysis
The price made a new all-time high yesterday, just below $7900. This is usually a bullish sign, but the volatility and strength of the sell-off from that level worries me. It suggests that there is going to be a stronger, deeper sell-off now. However, the price has not reached the nearest key support level at $6815.36 yet, or even either of the bullish trend lines which might be expected to act as support too, so there is no reason to panic yet. The volatility is also tapering off. The strong sell-off deters me from looking for a long at the key round number of $7000.00 which is confluent with a trend line and might also hold before the lower level is reached. It is worth keeping a very close eye on the action over the coming hours. If volatility lessons and the movement is more orderly, the bulls should hold. If there is a strong break below $6815.36 we might see some panicked liquidations triggering a sharper fall.
Regarding the USD, there will be a release of Unemployment Claims data at 1:30pm London time.


