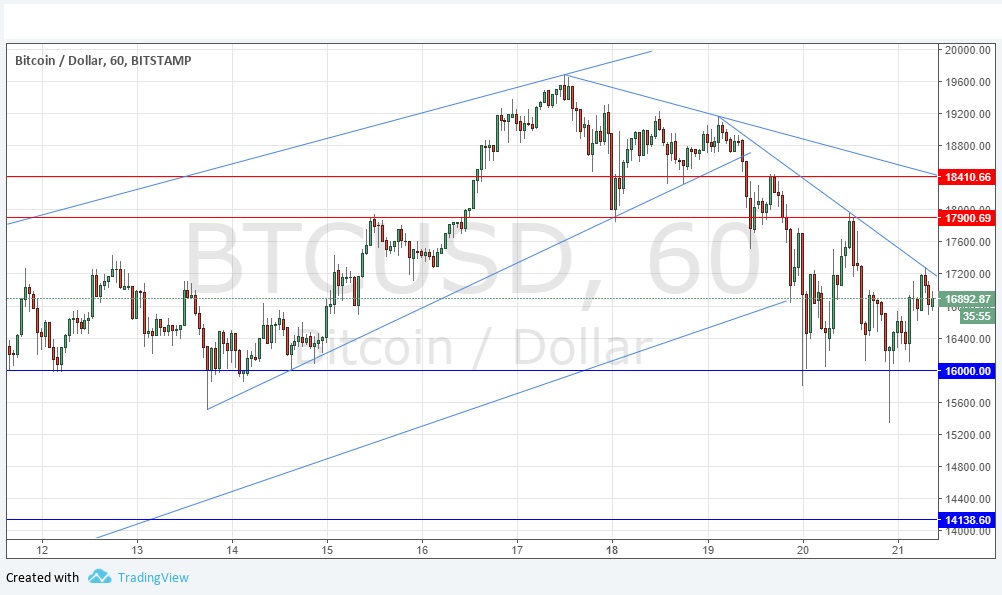
Yesterday’s signals produced a profitable long trade from the bullish pin candlestick rejecting the support level at $16,000. I would take most of the profit off this trade, so it can’t lose overall, and hope for a dramatic recovery in the price to follow.
Today’s BTC/USD Signals
Risk 1.00% per trade.
Trades must be taken from 8am New York time until 5pm Tokyo time, over the next 24 hours only.
Long Trades
· Go long after a bullish price action reversal on the H1 time frame following the next touch of $16,000 or $14,139.
· Put the stop loss 1 pip below the local swing low.
· Adjust the stop loss to break even once the trade is $200 in profit by price.
· Take off 50% of the position as profit when the trade is $200 in profit by price and leave the remainder of the position to ride.
Short Trades
· Short entry after a bearish price action reversal on the H1 time frame following the next touch of $17,705 or $18,411.
· Place the stop loss 1 pip above the local swing high.
· Move the stop loss to break even once the trade is $200 in profit by price.
· Remove 50% of the position as profit when the trade is $200 in profit by price and leave the remainder of the position to run.
The best method to identify a classic “price action reversal” is for an hourly candle to close, such as a pin bar, a doji, an outside or even just an engulfing candle with a higher close. You can exploit these levels or zones by watching the price action that occurs at the given levels.
BTC/USD Analysis
I wrote yesterday that Bitcoin had reached a pivotal movement: $16,000 will either be a good level to buy at, or, if it breaks down, we were increasingly likely to see another sharp fall that could even go below $10,000. It is time for anyone trading or investing in Bitcoin to watch what happens to the price over the next day or so very closely. My bias will largely be determined by whether $16,000 holds. I think this has proven to be a correct approach. The level at $16,000 is clearly holding, but steeper bearish trend lines can now be drawn, and the price has been unable to establish any higher support levels. The initial indication is that the medium-term bullish trend will survive, but it still looks in great danger. If Bitcoin breaks below $16,000 we are likely to see a fast move down to the next support level near $14,000 and possible even far below that. Anyone in Bitcoin needs to watch the chart very carefully, what happens from $16,000 is going to be the key.
Regarding the USD, there will be a release of Final GDP data at 1:30pm London time.

