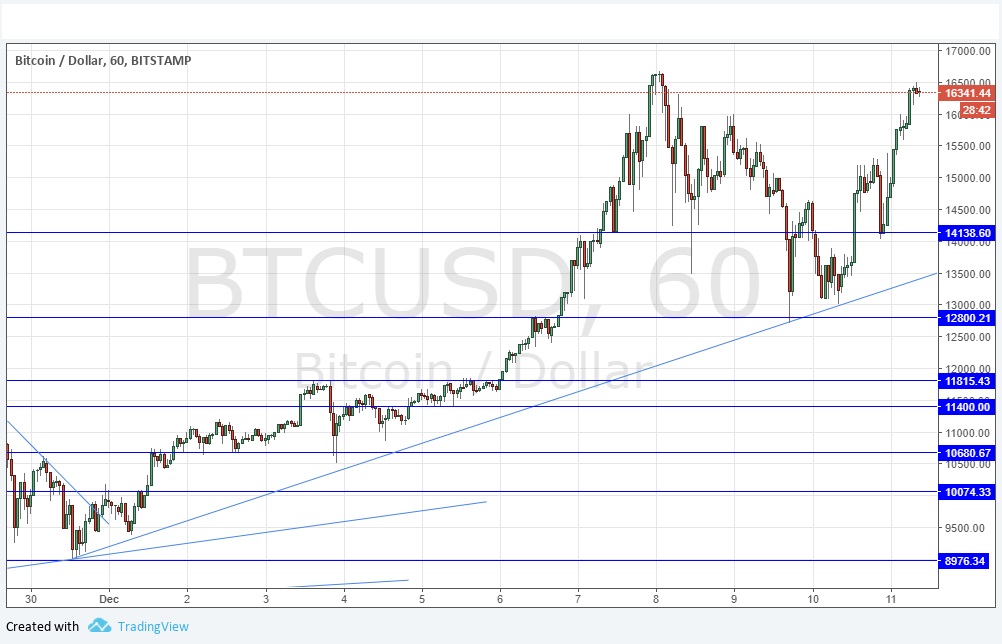
Last Thursday’s signals produced a good long trade from the bullish “dark cloud cover” candlestick rejecting the support level of $14,138.60.
Today’s BTC/USD Signals
Risk 1.00% per trade.
Trades may only be entered before 5pm New York time today.
Long Trades
Long entry after a bullish price action reversal on the H1 time frame following the next touch of $14,138.60, $12,800.21 or $11,815.43.
Place the stop loss 1 pip below the local swing low.
Move the stop loss to break even once the trade is $200 in profit by price.
Remove 50% of the position as profit when the trade is $200 in profit by price and leave the remainder of the position to run.
The best method to identify a classic “price action reversal” is for an hourly candle to close, such as a pin bar, a doji, an outside or even just an engulfing candle with a higher close. You can exploit these levels or zones by watching the price action that occurs at the given levels.
BTC/USD Analysis
I wrote last Thursday that the price was likely to advance over the short-term, but also that a severe correction was very likely to happen. The price continued to rise, with wild volatility, making a new all-time high just under $17,000 before falling by more than 25% in value and recovering strongly, all within the space of a few days. The movements are enormous, and as public interest grows, it becomes increasingly likely that there will be a severe correction and possibly even a crash, as early investors grow more and more tempted to cash in on floating profits.
The technical picture is interesting: the price has recovered, but has not yet reached the all-time high made last week. A failure here could see a major double top form, and a medium-term bear market emerge. However, a bullish outcome is still more likely. The price should be watched very carefully here over the next day or so as the market is going to have to show its hand at about $17,000.
I have a cautiously bullish bias.
There is nothing important due today regarding the USD


