The difference between success and failure in Forex trading is very likely to depend upon which currency pairs you choose to trade each week, and not on the exact trading methods you might use to determine trade entries and exits. Each week I am going to analyze fundamentals, sentiment and technical positions in order to determine which currency pairs are most likely to produce the easiest and most profitable trading opportunities over the next week. In some cases it will be trading the trend. In other cases it will be trading support and resistance levels during more ranging markets.
Big Picture 17th December 2017
In my previous piece two weeks ago, I saw the best possible trades for the coming week as long of the S&P 500 Index, and long of USD/JPY. The individual results were mixed, but the overall result was positive, as the S&P 500 Index rose by 0.35%, while the USD/JPY currency pair rose by 0.58%, producing an average gain of 0.47%.
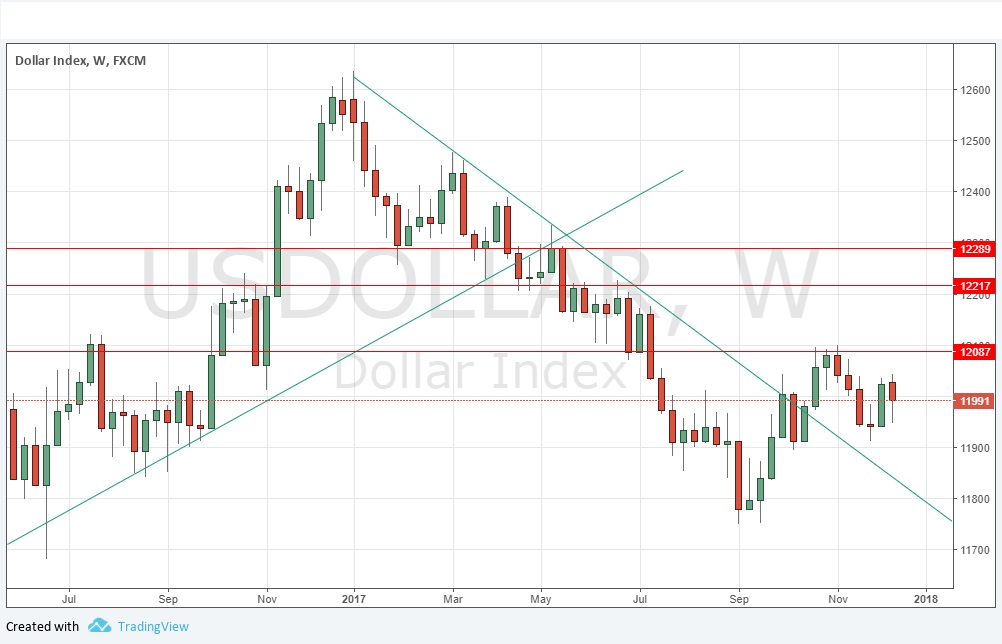
The Forex market over the past week was a little bearish on the U.S. Dollar, even though the FOMC raised rates by 0.25% and maintained its stance of forecasting an additional three rate hikes over 2018. The FOMC also increased its growth forecast, and a program of tax cuts which will ensure a major reduction in corporation tax is on its way. Technically the Dollar is above its price of three months ago, and it looks mildly bullish, but still likely to consolidate for a while longer.
The news agenda this week is almost certainly going to be dominated by the Final GDP number from the U.S. as well as central bank input from the Bank of Japan and the Reserve Bank of Australia.
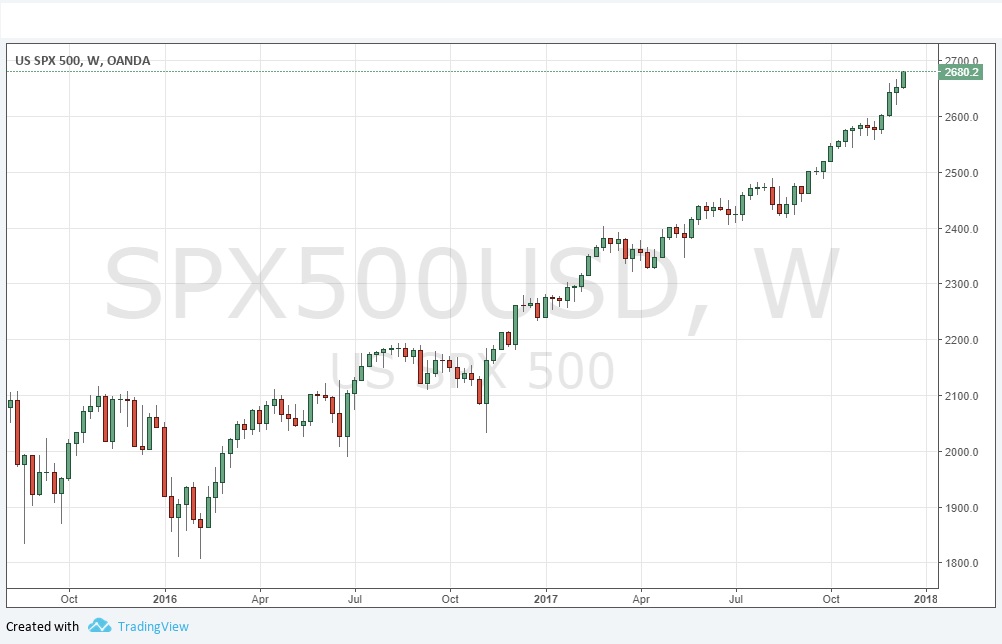
The American stock market is in a strong long-term bullish trend, and it made a new all-time high price on Friday. None of the three major Forex pairs are in convincing long-term trends, except possibly the USD/JPY, but the bullish trend here looks very weak.
Following the current picture, I see the highest probability trades this week as long of the S&P 500 Index, and long of the precious metal Palladium in U.S. Dollar terms.
Fundamental Analysis & Market Sentiment
The market is largely bullish and “risk-on”, with the stock market looking particularly strong, while the U.S. Dollar looks mildly bullish. Fundamental factors are mostly supporting the U.S. Dollar, but do not give obvious short counterparties.
Technical Analysis
U.S. Dollar Index
This index printed a relatively large bullish candlestick, which closed down but in its top half and with a large lower wick. There was also an invalidation of a resistance level, and the price is above its level of 3 months ago. There is no long-term trend, but the signs technically are mildly bullish.
S&P 500 Index
This pair is a strong long-term upwards trend, and just made a new all-time high price on Friday, which means it will probably continue to rise further. Buying stocks at all-time highs of the major index is usually a good strategy, even though the financial media is full of warnings as to how stocks are about to crash. These warnings have been coming for months; those who ignored them and bought have been rewarded. The market will probably crash or correct sharply eventually but meanwhile, there is money to be made on the long side. The fact that the week closed very close to its high is a bullish sign.
Palladium/USD
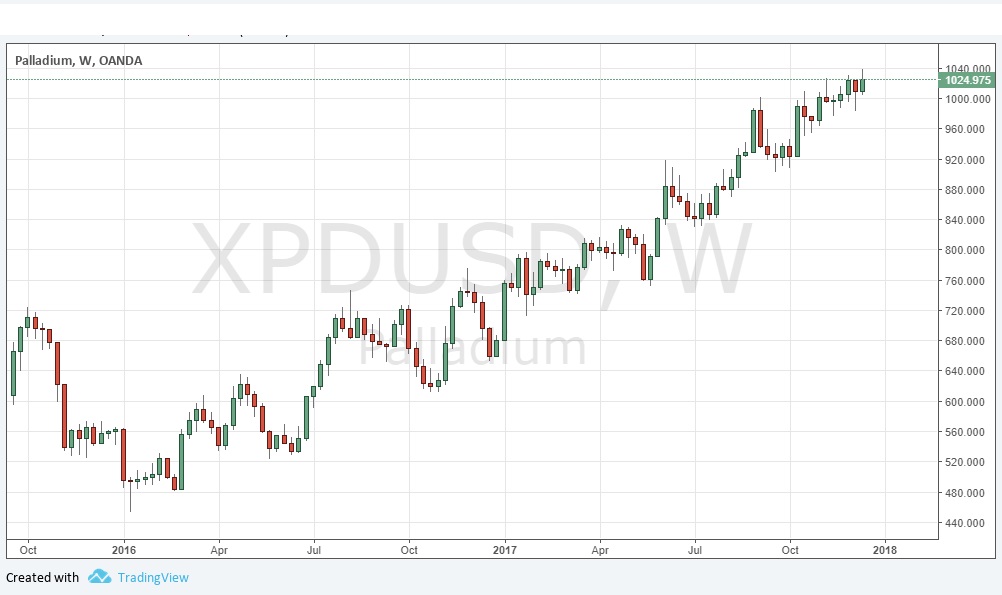
This pair is a long-term upwards trend, and it has been rising since the start of 2016, since when it has more than doubled in value. Palladium is a rare metal whose most major use is in manufacturing catalytic converters. While the weekly movements are difficult to predict, trend traders who are prepared to hold for the long term could find a long trade here interesting. One potential difficulty with this trade is the fact that many CFD brokers either do not offer Palladium, or if they do, they charge a large spread.
Conclusion
Bullish on the S&P 500 Index, and Palladium/USD.


