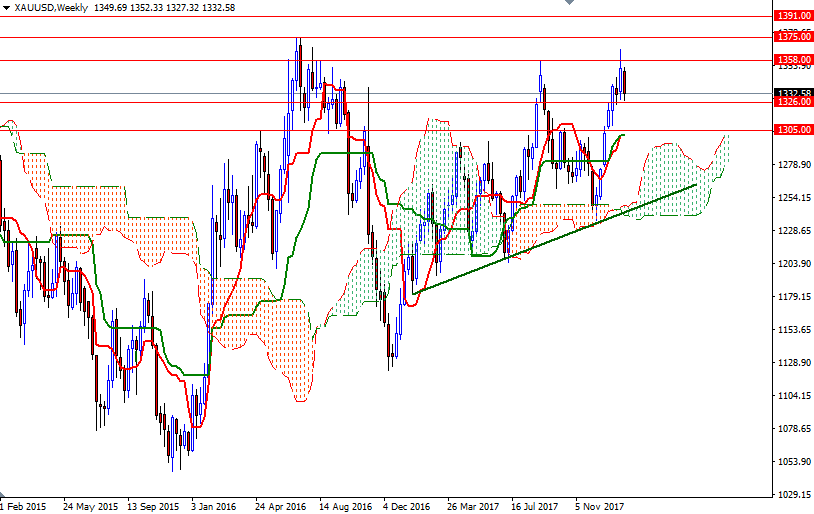
Gold prices settled at $1332.58 an ounce on Friday, suffering a loss of 1.27% on the week, as the dollar edged up on a corrective bounce from recent strong downside pressure. Some profit-taking was also behind gold’s decline last week. The market's failure to hold above the $1251-$1251 area prompted investors to step back from their bullish bets on the precious metal. The latest data from the Commodity Futures Trading Commission (CFTC) showed that speculative traders on the Chicago Mercantile Exchange reduced their net-long positions in gold to 207262 contracts, from 214684 a week earlier.
The U.S. dollar rose on Friday after the Labor Department reported that the economy added 200K jobs in January, surpassing consensus estimates of 181K, and average hourly wages jumped 0.3%. San Francisco Federal Reserve Bank President John Williams said “Last year the Committee signaled the likelihood of further gradual rate increases in 2018, and, as I said earlier, my own view is we should stick to that plan.” While concerns that the Federal Reserve will raise rates four times this year instead of the three may weigh on the gold market, recent volatility in major equity markets around the globe can limit potential downside.
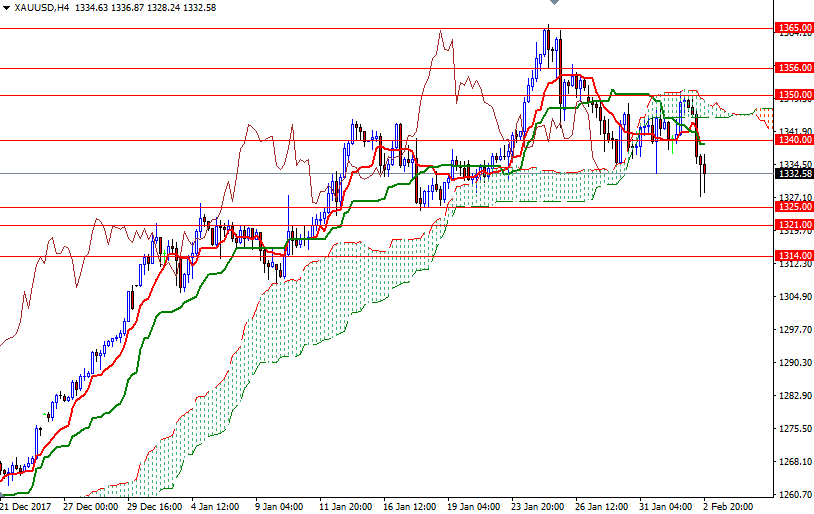
The near-term technical charts turned bearish last week. This was not a big surprise though - last week, I had warned about some normal profit-taking and chart consolidation in the near term. XAU/USD is trading below the Ichimoku clouds on the H4 and the H1 time frames, and we have negatively aligned Tenkan-sen (nine-period moving average, red line) and Kijun-sen (twenty six-period moving average, green line) on both charts. If the market can't stay above the 1326/1 area, prices will tend to move towards the daily Ichimoku cloud. In that case, look for further downside with 1314/2 (the 38.2% retracement of the bullish run from 1236.40 to 1365.95) and 1308/4 as targets. The support in the 1308/4 area should restrict any further declines but if it is broken, then the market will test 1300-1298 next. A drop below there suggests the bears are aiming for 1294/2, the top of the weekly cloud.
The first hurdle gold needs to jump is located in 1346/4. If the market can penetrate this barrier and hold above the 4-hourly Ichimoku cloud, then we may revisit 1351/0. The bulls will have to overcome the key technical resistance in the 1358/6 area in order to set sail for the 1365. Beyond there, the 1375 level stands out as a solid resistance. Closing above 1375 on a daily basis could attract new buying and open a path to the 1391 level.


