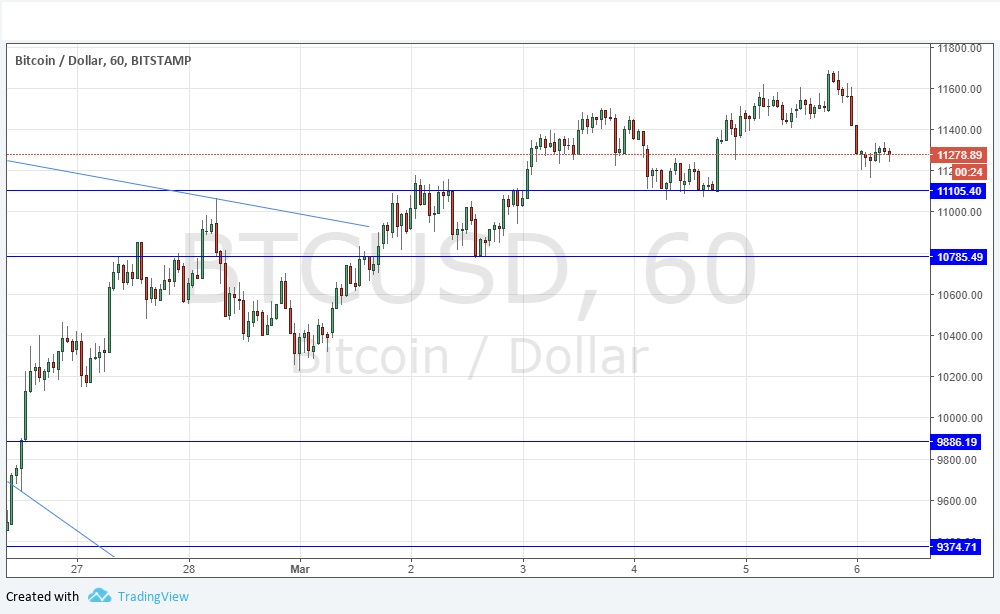
Yesterday’s signals were not triggered, as neither of the key levels were ever reached.
Today’s BTC/USD Signals
Risk 0.75% per trade.
Trades can be entered until 5pm Tokyo time, during the next 24-hour period only.
Long Trades
Long entry after a bullish price action reversal on the H1 time frame following the next touch of $11,105 or $10,785.
Put the stop loss 1 pip below the local swing low.
Adjust the stop loss to break even once the trade is $200 in profit by price.
Take off 50% of the position as profit when the trade is $200 in profit by price and leave the remainder of the position to ride.
The best method to identify a classic “price action reversal” is for an hourly candle to close, such as a pin bar, a doji, an outside or even just an engulfing candle with a higher close. You can exploit these levels or zones by watching the price action that occurs at the given levels.
BTC/USD Analysis
I wrote yesterday that as there was now no obvious resistance below $13,000 so there was every reason to be bullish and expect the price to rise higher in the direction of least resistance. The price did rise during the London session, but fell more sharply later, and has almost reached the nearest support level at $11,105. Over recent hours, it is showing signs of bottoming out and preparing to rise again. Despite the drop, I maintain my bullish bias – there is clearly a bullish structure of higher lows and highs which has remained intact, and if the price does touch $11,105 and bounce it should be a good opportunity to enter a long trade. The price has lots of room to rise much higher. Both nearby support levels could see the formation of excellent medium-term double bottoms from which the price could rise.
There is nothing due today concerning the USD.

