The difference between success and failure in Forex trading is very likely to depend upon which currency pairs you choose to trade each week, and not on the exact trading methods you might use to determine trade entries and exits. Each week I am going to analyze fundamentals, sentiment and technical positions in order to determine which currency pairs are most likely to produce the easiest and most profitable trading opportunities over the next week. In some cases it will be trading the trend. In other cases it will be trading support and resistance levels during more ranging markets.
Big Picture 25th March 2018
In my previous piece last week, I saw the best possible trades for the coming week as long of the GBP/USD currency pair, and short of the USD/JPY currency pair. This worked out well in both the trades, with GBP/USD ending the week up by 1.37% while the USD/JPY fell by 1.17%, producing an average gain of 1.27%.
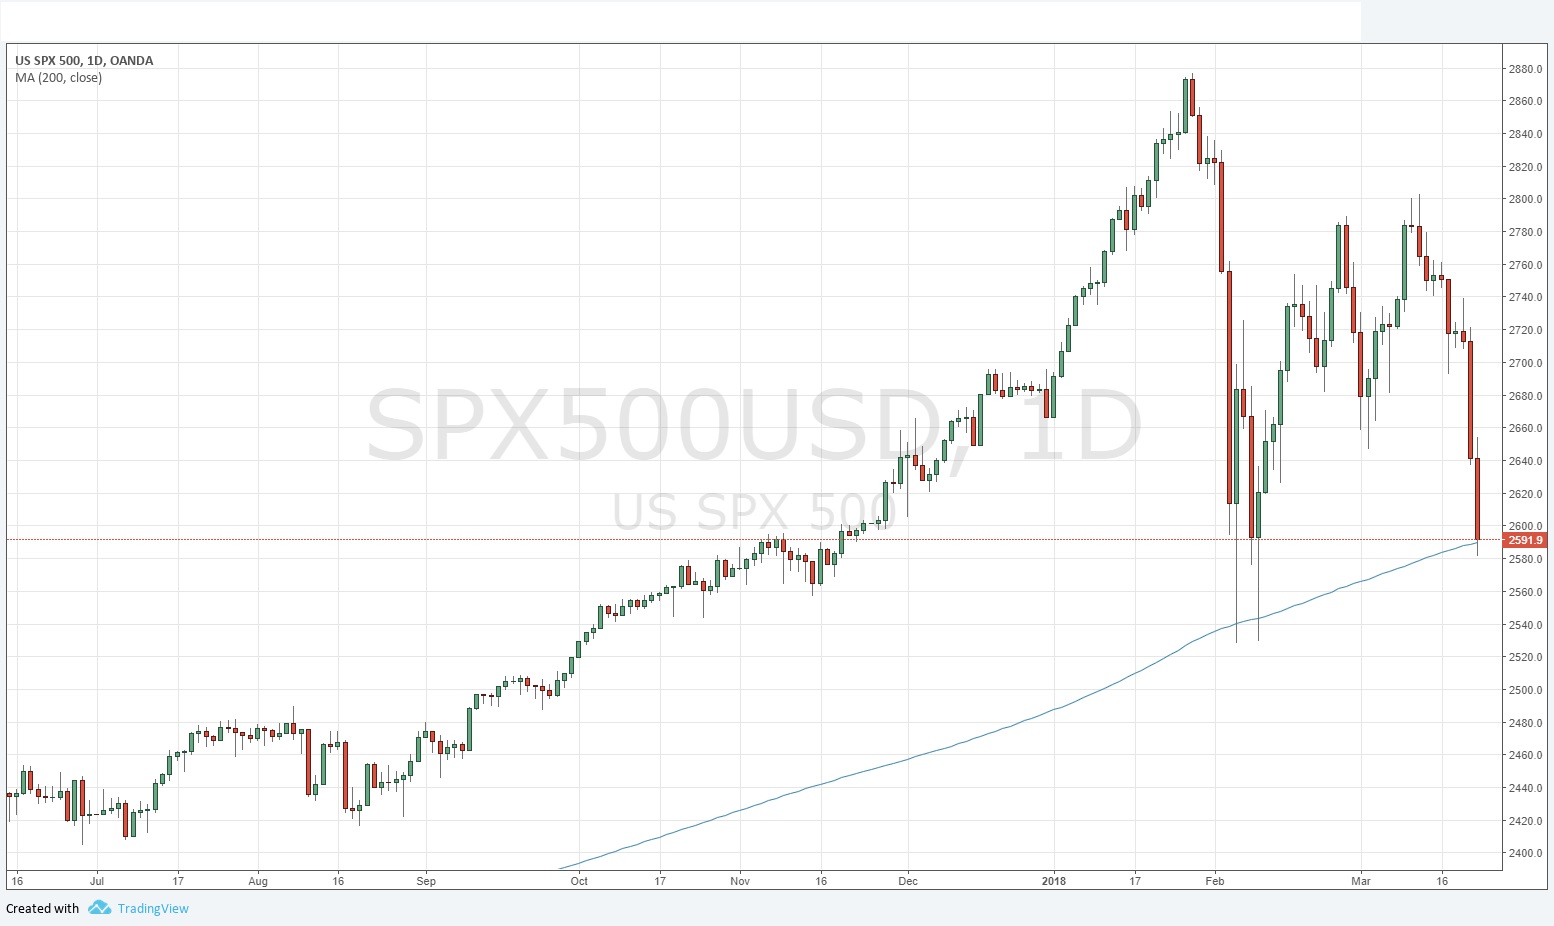
Last week saw some market turmoil, not in Forex but in the stock market. This has been caused partly by President Trump’s potential legal problems which I highlighted last week, but the major cause has been the President announcement of the planned imposition of tariffs on about 10% of Chinese important. The Chinese look set to impose retaliatory tariffs. The markets do not like it, and the S&P 500 Index fell strongly during the final two days of last week. Friday’s closing price was only a couple of points above the 200-day moving average, which is seen by many analysts as a dividing line between a bull market and bear market. Friday’s close was also the lowest daily closing price in about 4 months. The major scheduled data release for the week took place with a “dovish” rate hike by the FOMC, which may have added to the weakening of the Dollar.
The overall effect of these developments was to leave the U.S. Dollar down, stock markets strongly down, and to boost the Japanese Yen, which often benefits as a safe-haven when stocks and other risk assets sell off. It is notable that Gold and Oil are also starting to make new higher prices. The market’s focus over the coming week will probably move to the Final GDP release for the U.S. economy.
Fundamental Analysis & Market Sentiment
Fundamental analysis tends to support the U.S. Dollar, while sentiment is against the U.S. Dollar, partly due to the dovish rate hike, and partly because there is a long-term trend against the U.S. Dollar which reinforces bearish sentiment. Sentiment is likely to remain unchanged until Wednesday’s Final GDP data, unless there are any new developments concerning U.S. / Chinese trade tariffs. Such news would probably have a bigger effect than any GDP number. Any surprises coming from the Mueller investigation which seem to threaten President Trump’s position could also be negative for the stock market if not necessarily for the U.S. Dollar.
Technical Analysis
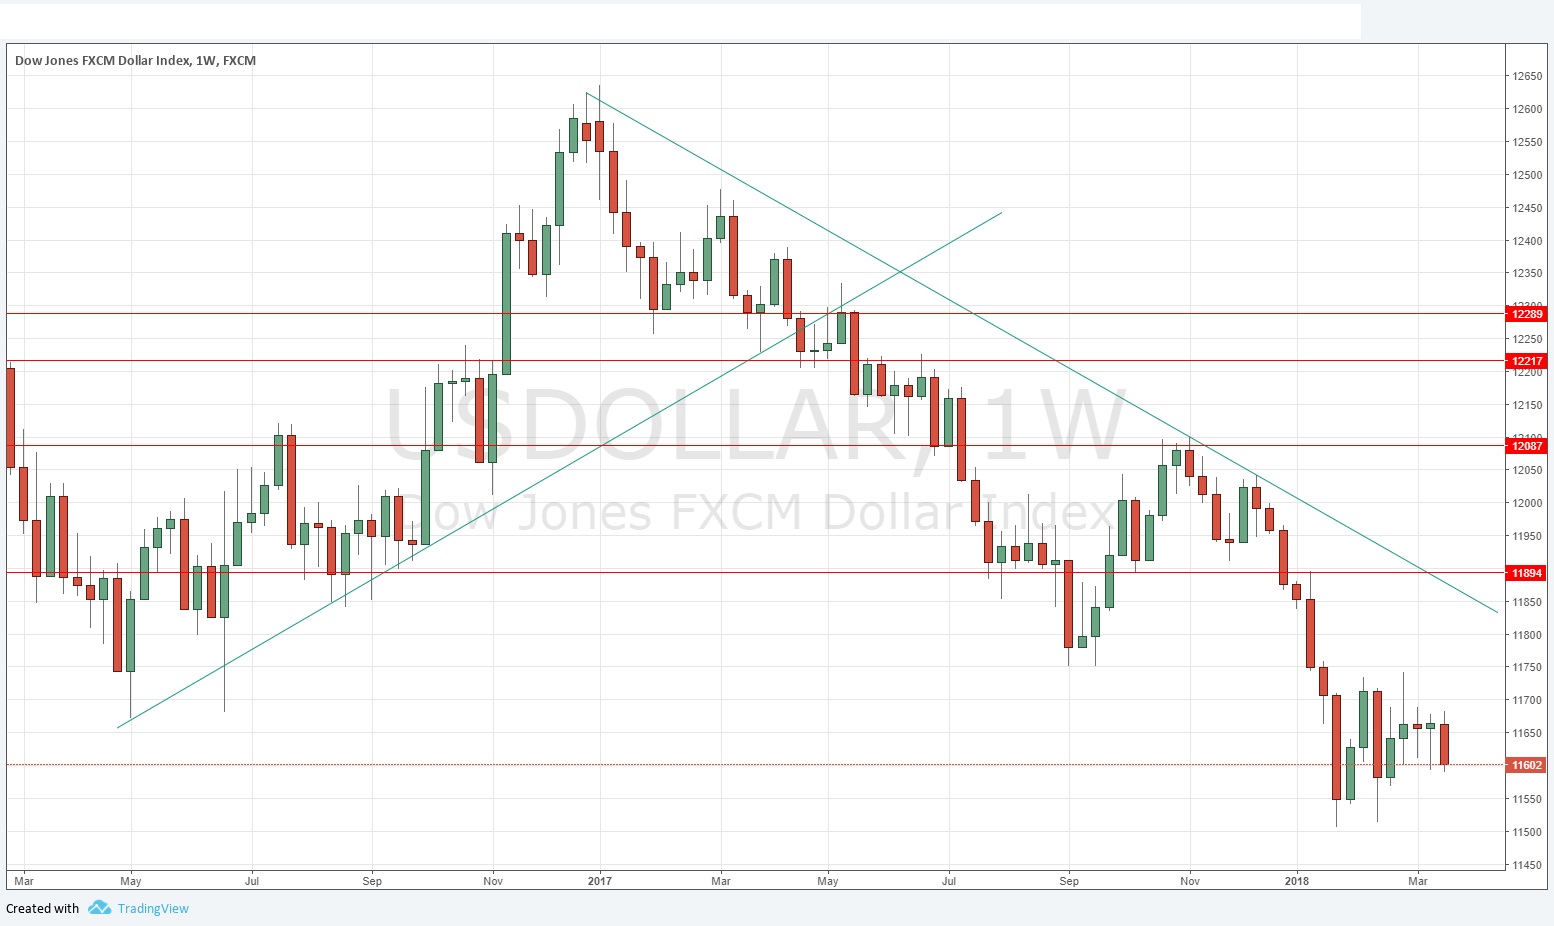
U.S. Dollar Index
This index printed a bearish outside candlestick, which signals a full resumption of the long-term bearish trend. The price is threatening to make a new low, following the consolidation over the past eight weeks, suggesting that the long-term bearish trend is getting going again. The fact that the week closed very close to its low is another bearish sign, so overall it looks bearish technically for the greenback.
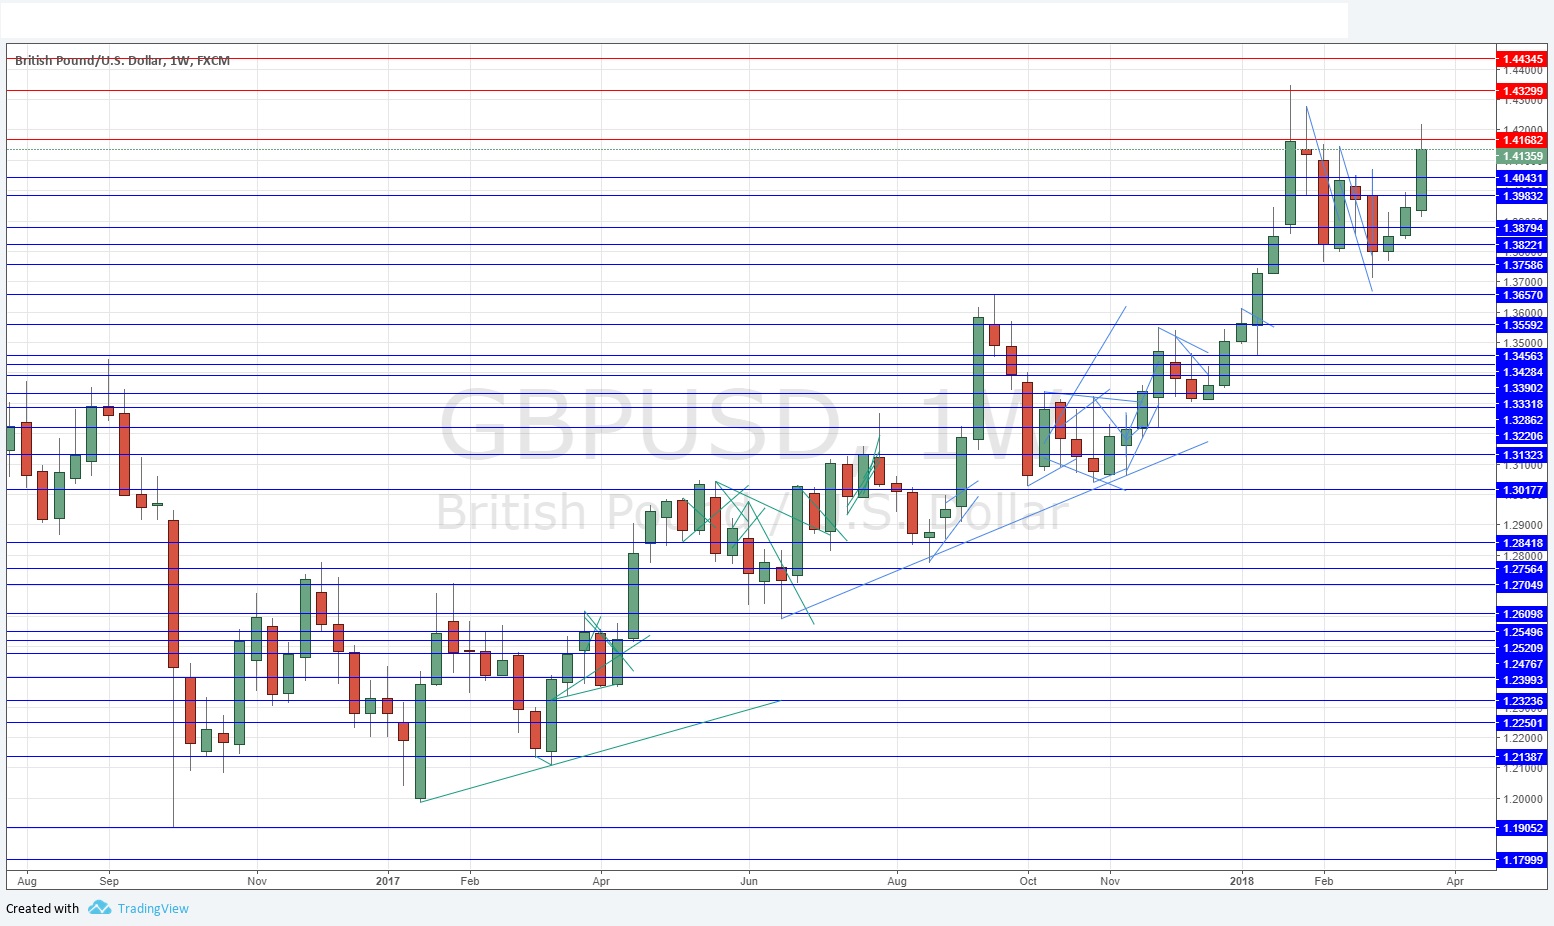
GBP/USD
This pair is in a long-term bullish trend. After consolidating over the past few weeks, it has begun to rise more strongly again. Last week’s candlestick was a relatively large bullish candlestick, although it has a notable upper wick which might give bulls a little caution now. Sentiment seems to be more bullish on the Pound than on the Euro, as last week saw the EUR/USD print a significantly less bullish candlestick, suggesting that being bullish of this pair over the coming week might be the better “with trend” trade for the week.
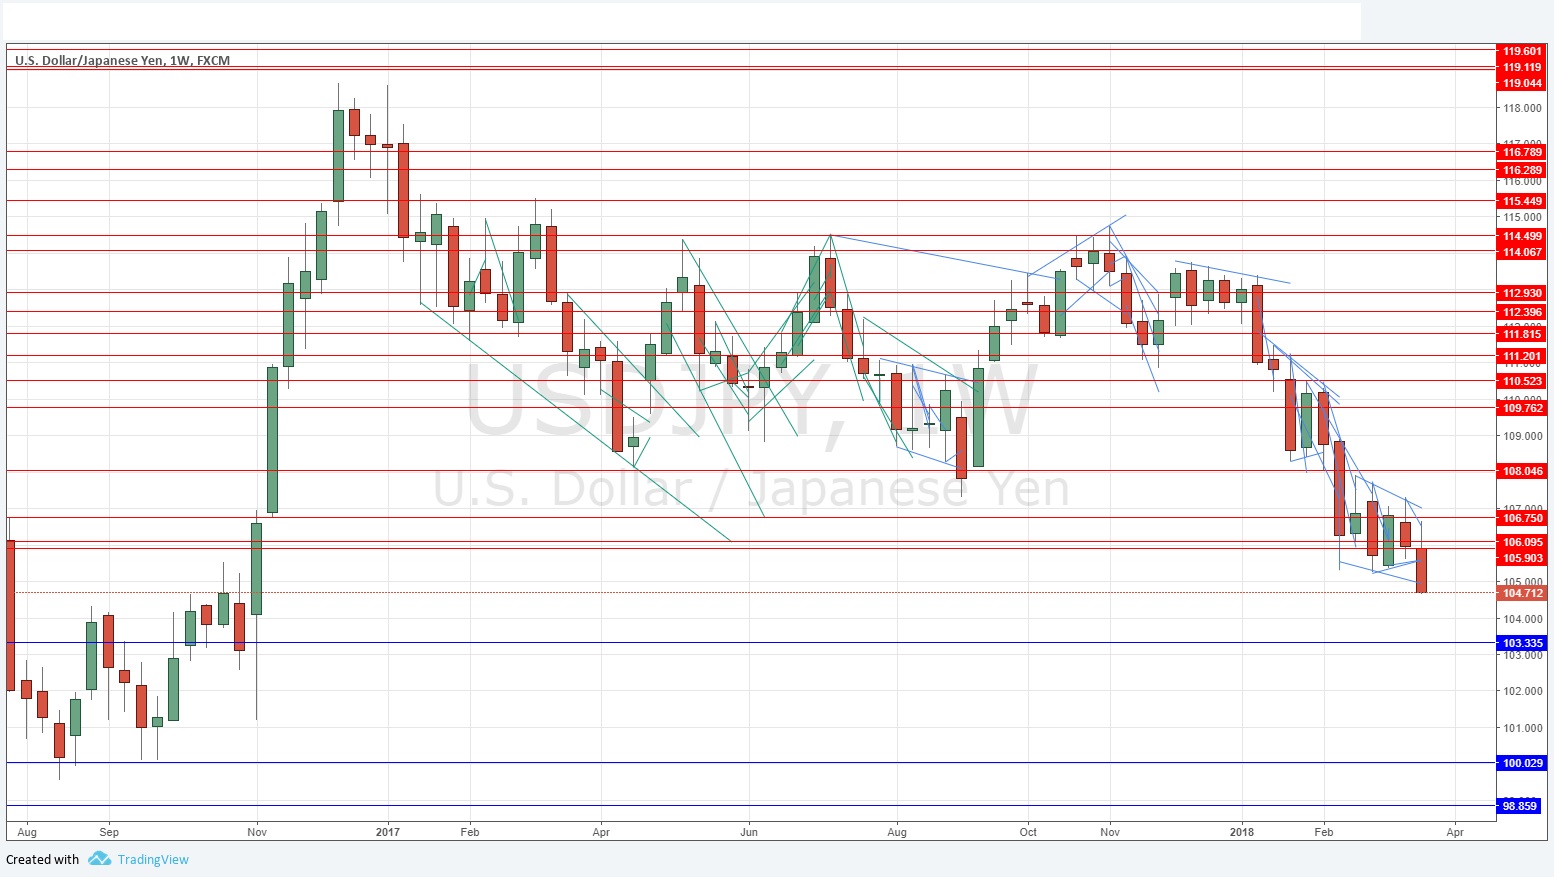
USD/JPY
This pair is in a long-term bearish trend, which is getting stronger. Last week not only closed right on its low, it made a new low price not seen since President Trump won the presidential election in 2016. This suggests this is a relatively good and powerful long-term trend despite its ranging nature which can be seen in the price chart below. Last week’s candlestick was a relatively large bearish candlestick. This could be the very best trend trade available in the Forex market right now.
S&P 500 Index
I just wanted to take a quick look at the U.S. stock market’s major index, so we can see that the stock market is looking dangerous and increasingly bearish. The moving average shown in the daily chart below is the 200-day simple moving average. Note the low close and the increase in volatility since the start of February.
Conclusion
Bullish on the GBP/USD currency pair; bearish on the USD/JPY currency pair.


