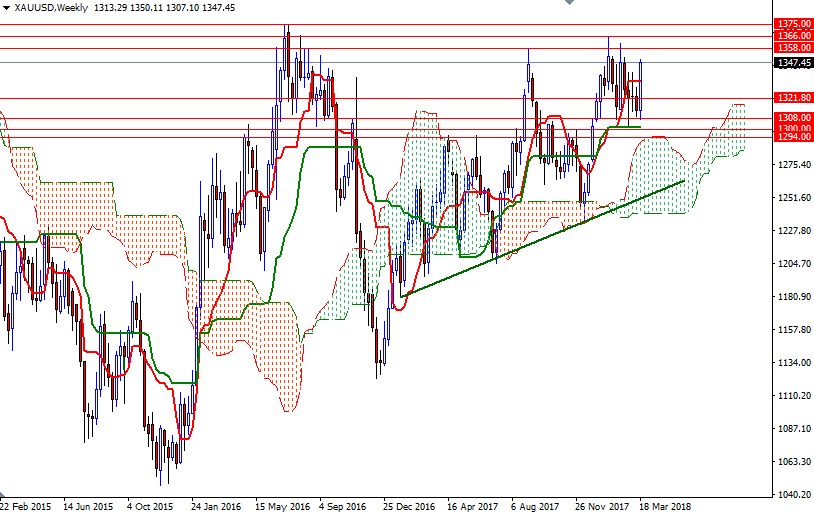
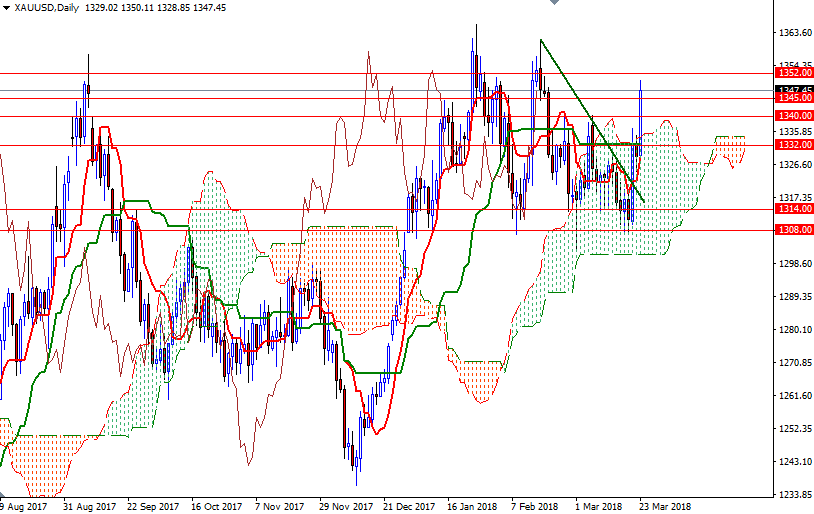
Gold prices settled at $1347.45 an ounce on Friday, scoring a gain of 2.6% on the week, as a softer dollar and worries over growing trade tensions between the U.S. and China prompted investors to seek refuge in gold. The Federal Reserve’s Open Market Committee raised interest rates by 0.25%, which was fully expected by the marketplace. The FOMC statement showed that policymakers were largely split as to whether a total of three or four rate hikes would be needed in 2018. World stock markets were mostly lower and U.S. stocks suffered their worst week in more than two years.
The daily and the 4-hourly charts for gold have turned more bullish recently, which was also inspiring chart-based buyers. The bulls were able to defend the key support in the 1308/5 area - and eventually they pushed prices back above the 4-hourly cloud. The Tenkan-Sen (nine-period moving average, red line) and the Kijun-Sen (twenty six-period moving average, green line) are positively aligned on both the weekly and the 4-hourly charts.
Despite this positive outlook, XAU/USD has to push its way through the 1252/0 zone challenge the next strategic resistance in 1360/58. A daily close above 1360 implies that the 1367/5 area will be the next port of call. If the bulls penetrate this barrier, look for further upside with 1375 as the next target. However, if the market stalls here and prices drop below 1340, we may head back to test the support in the 1334/2 area. The bears have to capture this camp to march towards 1328/5. A break below 1325 suggests that the market will be aiming for 1321-1320. If this support is invalidated, 1316/4 will be the next stop.


