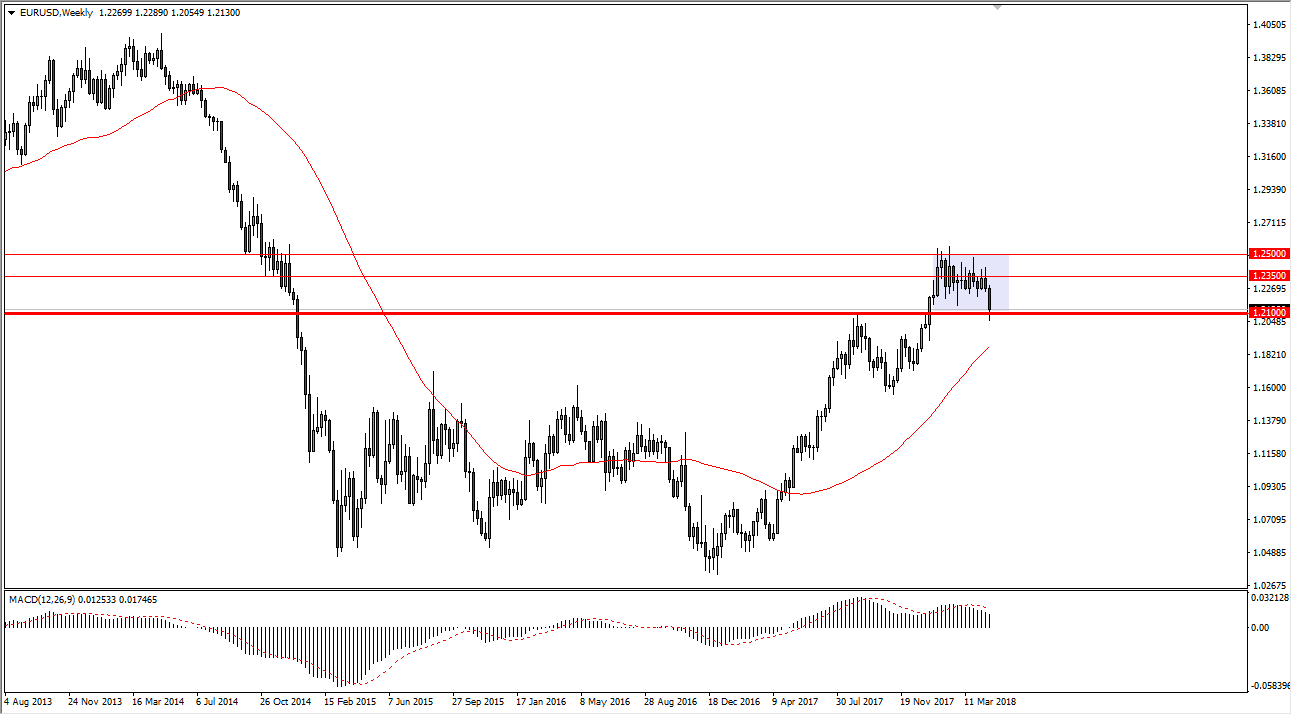
The EUR/USD pair was sideways most of the month of April, but then broke down significantly to crash into the 1.21 handle. The market had seen a lot of resistance at that level previously, so it should now find signs of support. For what it’s worth, the Friday session of the last full week of the month ended up forming a hammer, and that of course is a bullish sign. I think that we will probably try to stay within the lavender box I have on the chart, meaning that we will hang between the 1.21 handle on the bottom and the 1.25 level on the top. However, there are a couple of scenarios that we need to pay attention to.
The 1.20 level underneath is massively supportive and if we were to break down below there it’s likely that the market should continue to be very negative at that point, perhaps unwinding to the 1.18 level, possibly the 1.15 level. However, if we bounce from here, and on the daily timeframe it’s starting to look like we could, then I think the 1.2350 level will be targeted initially, followed by the 1.25 level. This market of course is paying attention to interest rates in the United States, as the 10-year yield has risen above 3% during the final week of the month, but has also rolled back a bit, putting a little bit of upward pressure in this pair on the 27th.
All things being equal, I would anticipate that we would go back and forth. However, those levels that I’ve mentioned previously been broken of course would change everything in this market. Breaking above the 1.25 level would be massive. When I look at the weekly chart, I see a bullish flag that measures for a move to the 1.32 handle, part of which breaking above the 1.21 handle was confirmation of.

