The difference between success and failure in Forex trading is very likely to depend upon which currency pairs you choose to trade each week, and not on the exact trading methods you might use to determine trade entries and exits. Each week I am going to analyze fundamentals, sentiment and technical positions in order to determine which currency pairs are most likely to produce the easiest and most profitable trading opportunities over the next week. In some cases it will be trading the trend. In other cases it will be trading support and resistance levels during more ranging markets.
Big Picture 15th April 2018
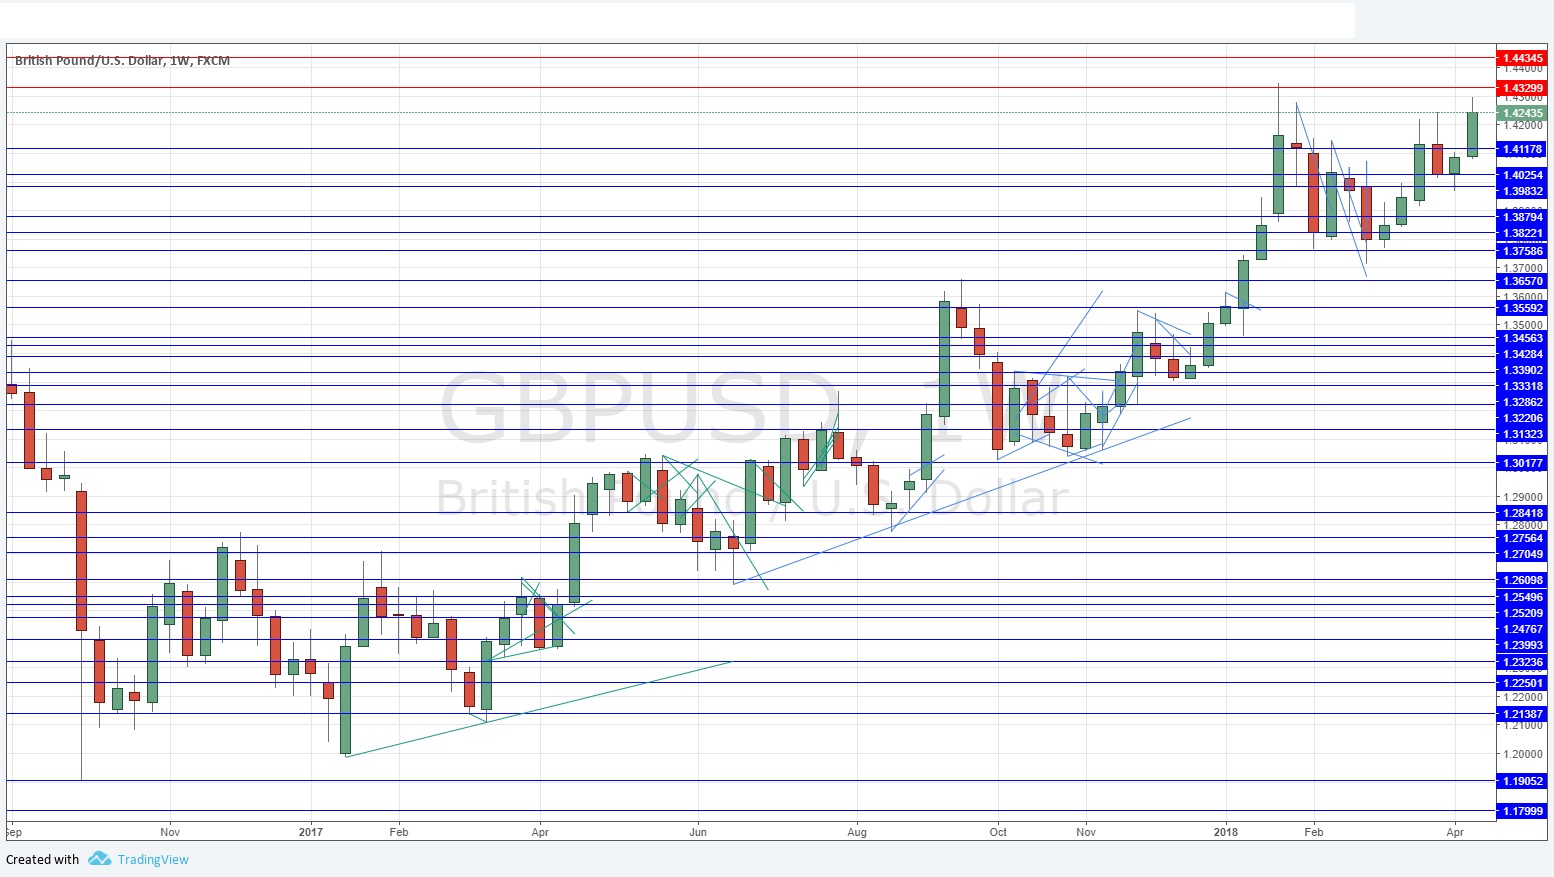
In my previous piece last week, the only call I made was long GBP/USD. This obviously worked out well, as the currency pair rose by 1.11% over the week.
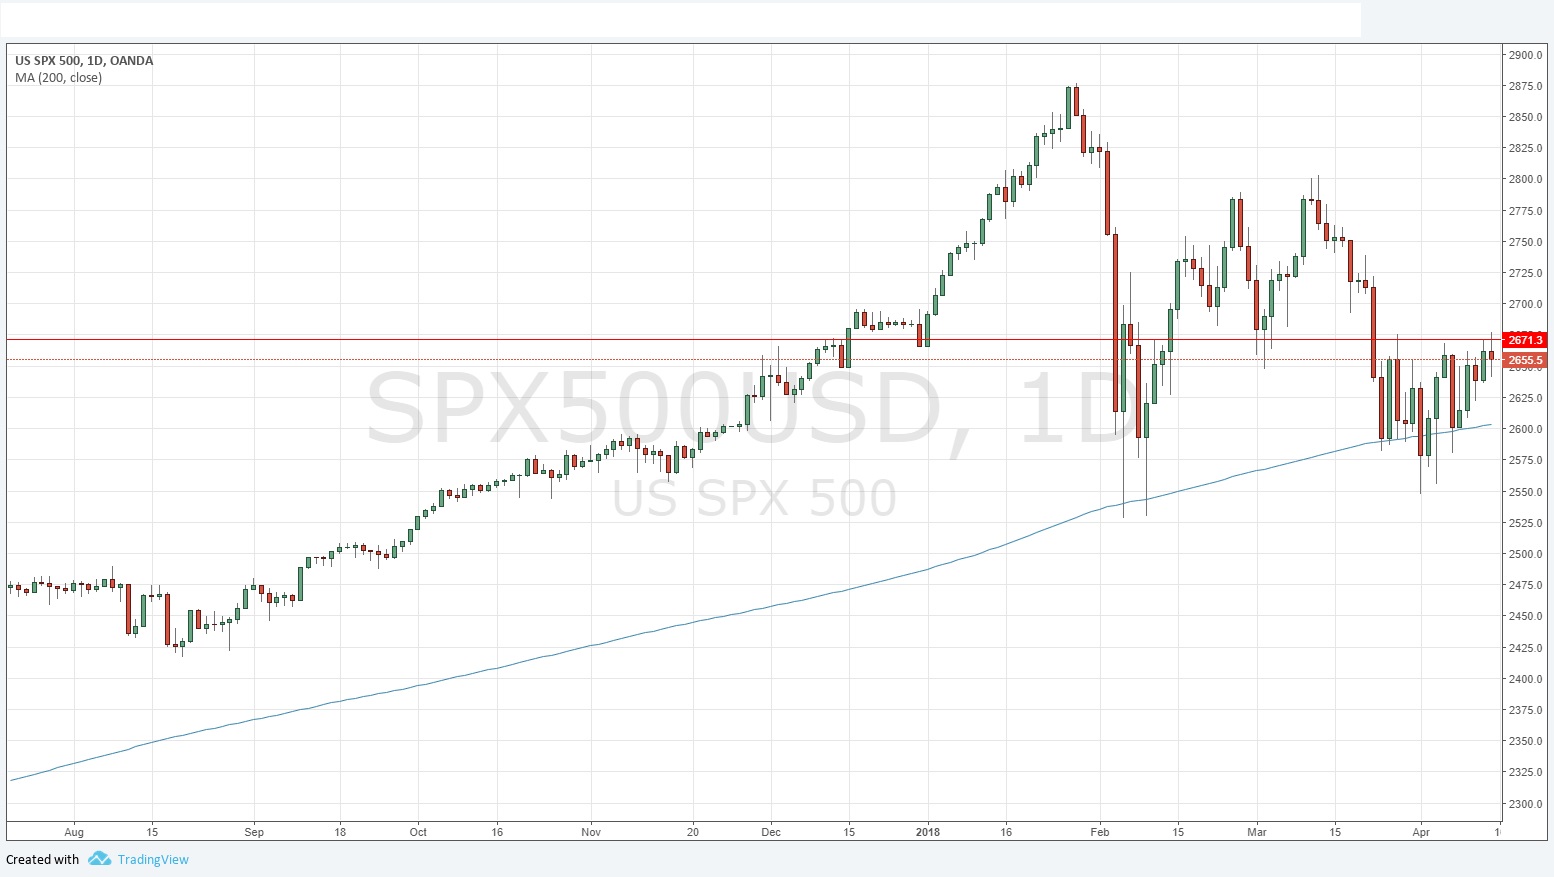
Last week again saw a still-volatile stock market where the S&P 500 ranged above a supportive 200-day simple moving average. The steady fall in stock valuations has been halted, but the chart still looks relatively dangerous for bulls. Tension over Syria played a role, albeit a relatively minor one. The major event in the Forex market was a release of weaker than expected U.S. inflation data, which had the logical effect of depressing the relatively value of the USD. It remains to be seen how the markets will feel about risk sentiment after the weekend’s events in Syria, although it seems clear an escalation of the conflict is not likely to be imminent, so it may be improved.
Risk and commodity currencies gained over the week, with the Canadian Dollar the strongest performer, which can be explained by the rise in the price of Crude Oil. It seems logical to suggest that tensions in the Middle East have played a part in that rise.
Fundamental Analysis & Market Sentiment
Fundamental analysis tends to support the U.S. Dollar; however, sentiment is contradicting this at present due to poorer than expected inflation data. There is little U.S. data scheduled for next week, so the greenback is likely to be most affected by any new developments concerning U.S. / Chinese trade tariffs or Russia / NATO tension.
Technical Analysis
U.S. Dollar Index
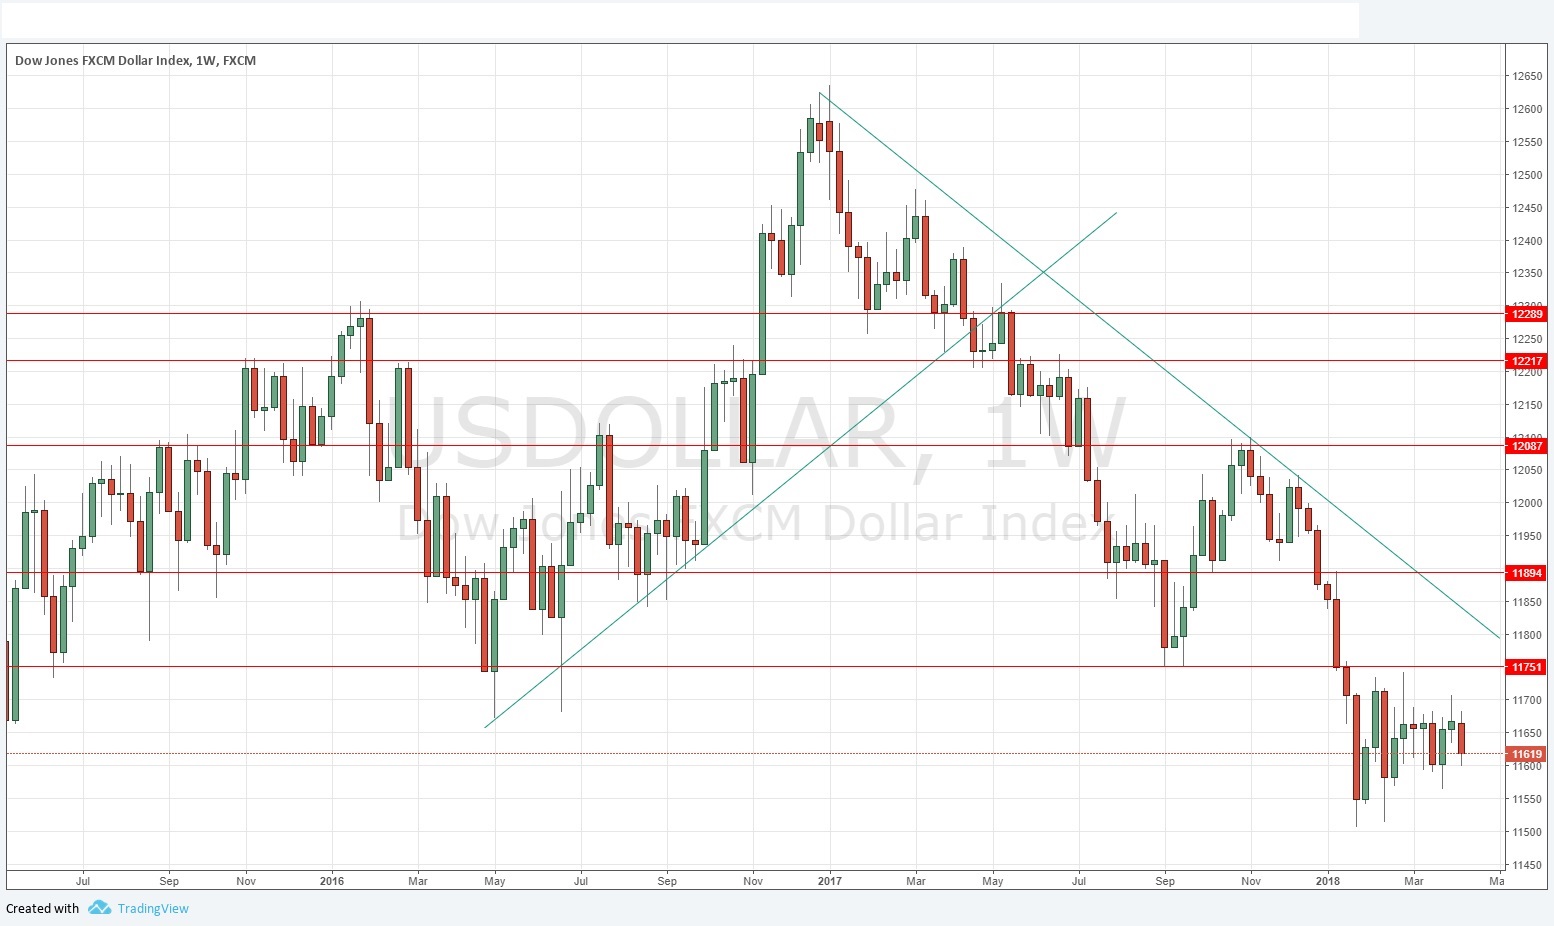
This index printed a small bearish engulfing candlestick, within a wider consolidation pattern which has lasted almost three months. This suggests the long-term bearish trend may be continuing, but far from decisively so. The bearish trend is still in force and worth following, but it should be treated with increasing caution regarding its reliability. On the other hand, the fact that all the resistance levels which have formed during this downwards trend are still intact suggests continuing bearishness. Overall, it is an increasingly inconclusive picture – but still bearish.
GBP/USD
This pair is in a long-term bullish trend and rose quite strongly last week. Last week’s candlestick was reasonably large and bullish. The problem for bulls and a reason for caution is the upper wick in the region of recent near 2-year high prices which were made a few weeks ago. Sentiment now seems to be more bullish on the Pound than on the Euro, which is another bullish sign. There is still a bullish trend here, but bulls might want to be a little cautious.
Crude Oil
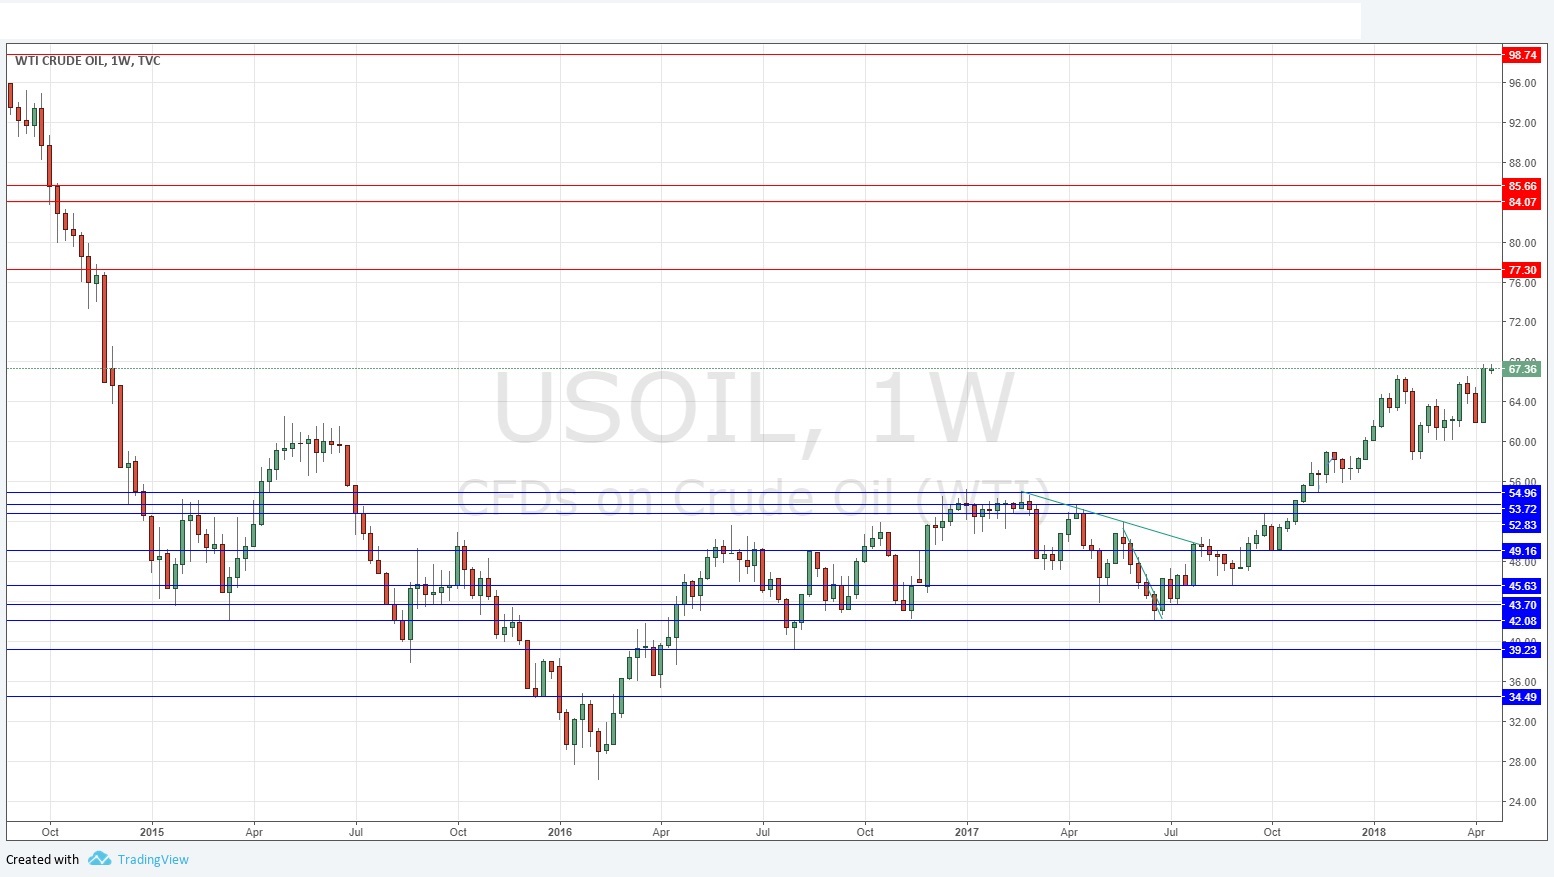
There is a strong long-term bullish trend, with the price continuing to make new 3.5-year highs. Last week’s candle was long, strong, and bullishly closed close to its top. The price may be volatile, but any increase in tension in the Middle East or surprise moves by any actors there should see the price rise further.
S&P 500 Index
I just wanted to take a quick look at the U.S. stock market’s major index, so we can see that the stock market is still looking dangerous and possibly bearish. The moving average shown in the daily chart below is the 200-day simple moving average. This is arguably action as support, but the level above at 2671 seems to be acting as resistance. A breakout in either direction should give more clues as to medium-term direction.
Conclusion
Bullish on GBP/USD and WTI Crude Oil.


