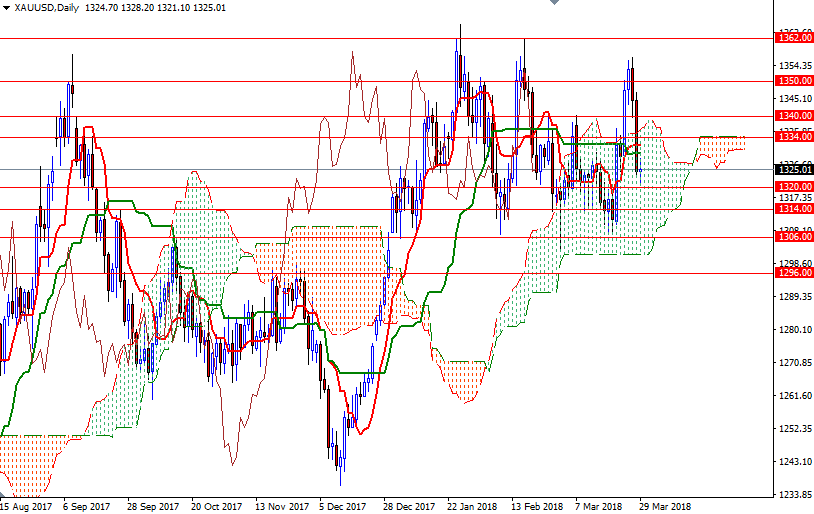
Gold prices settled at $1325.01 an ounce, suffering a loss of 1.67% over the holiday-shortened week but making a gain of 0.47% over the month. The key factor that weighted on the market was very much fears about more interest rate increases than expected this year. The uptick in volatility in global stock markets and concerns about increased trade barriers, on the other hand, were supportive elements for gold. A heavy slate of key economic indicators will be released this week, but the highlight of the week will come on Friday when the Labor Department releases its employment report for March.
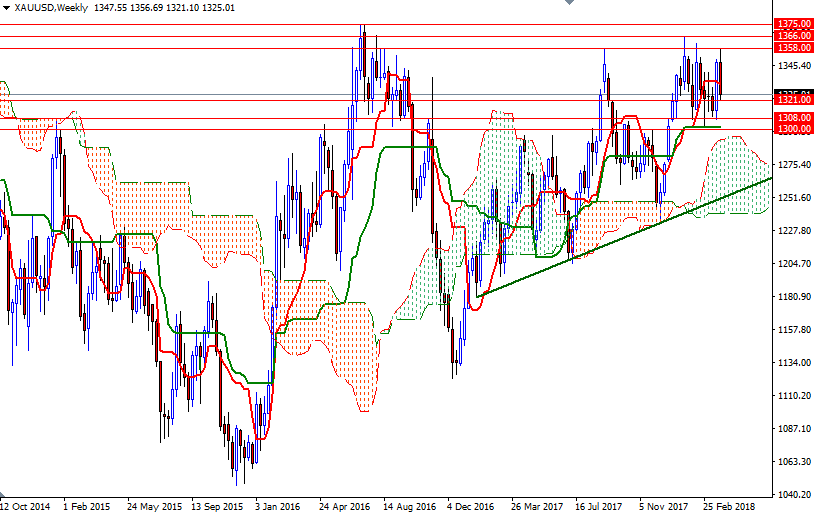
XAU/USD tested the support in the 1308/6 area a few times before breaking above 1340 and challenging the first important barrier at 1358. Not surprisingly, investors cashed in gains following the metal’s failure to breach this key technical level. The bulls have the overall long-term technical advantage, with the market trading above the weekly clouds. We also have positively aligned Tenkan-sen (nine-period moving average, red line) and Kijun-sen (twenty six-period moving average, green line) on the same chart. However, these lines indicate that the bulls don’t have technical momentum (to break out of the trading range that the market has been trapped for the past three months) on their side yet. With these in mind, I think the rangy conditions with a bullish bias will persist unless prices dive below 1294, the top of the weekly cloud.
The 1358 level will be the key for the bulls to pass in order to challenge the bears on the 1366 battlefield. Beyond there, 1375 stands out as a solid technical resistance. If this resistance is broken, look for further upside with 1392/0 and 1400 as targets. A break above 1400 is essential for a continuation towards 1418/13. To the downside, the bears will have to produce a close below the solid support in the 1308/6 zone. If they confidently pull prices below 1306, the market will test 1296/4 or even 1290. Diving below 1290 could increase speculative selling and pave the way towards 1277/5. On its way down, expect to some support in the 1285/2 area.


