S&P 500
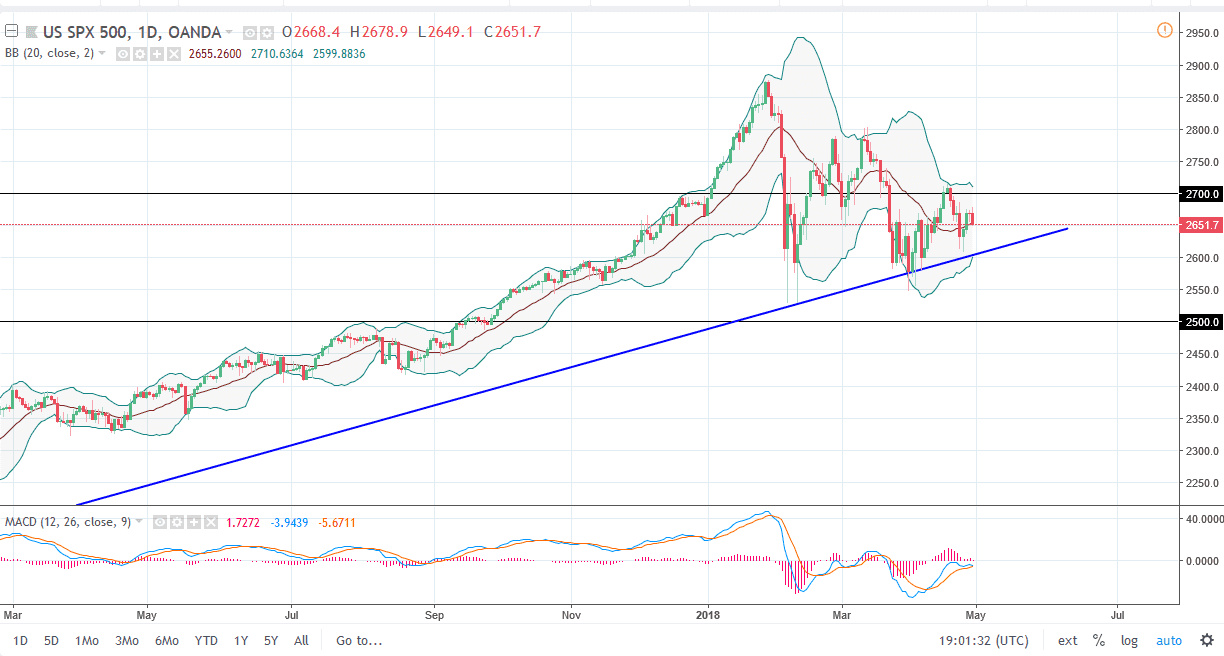
The S&P 500 has fallen a bit during the trading session on Monday, showing signs of volatility yet again. When I look at this market, the most important part of this chart is the uptrend line. If we can stay above the uptrend line, we should eventually find buyers. We have seen a nice bounce from the uptrend line, but Monday was a bit of a letdown. It is because of this that I am paying attention to roughly the 2600 level, an area that if we break down below would clear the uptrend line to perhaps reaching down towards the 2500 level, and beyond there. Otherwise, if we bounce or break above the 2700 level, I think that the S&P 500 should continue to go much higher. Recently, the highs have been getting lower, so that’s part of what makes me cautious in the meantime.
NASDAQ 100
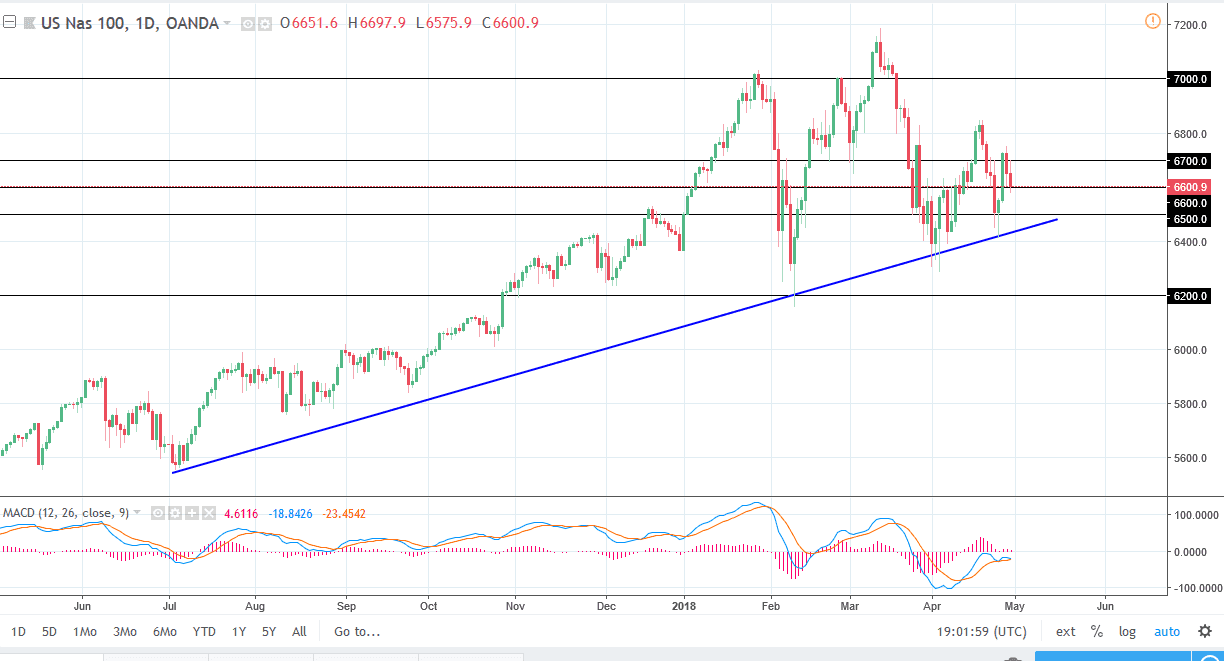
The NASDAQ 100 initially tried to rally during the day on Monday but found the 6700 level to be a bit too much. We reached down to the 6600 level, an area that should be a lot of support, extending down to the uptrend line below. I think eventually the buyers could return, but if we did breakdown below the 6400 level, the market probably drops down to the 6200 level. I’m waiting for some type of supportive candle or a bounce on the daily chart to take advantage of momentum, but if we break down below the uptrend line, things could get rather ugly and I think we could see the market unwinding rather rapidly. One thing I think you can count on is quite a bit of choppiness and volatility.


