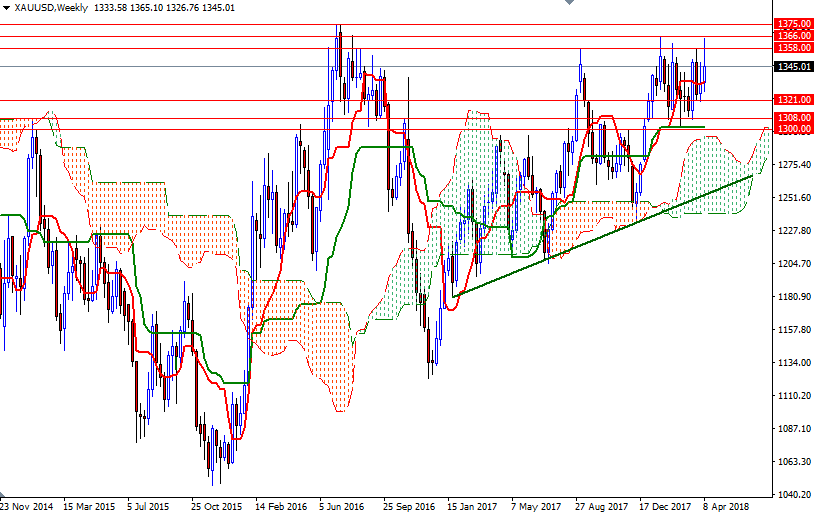
Gold ended the week up $11.43 at $1345.01 an ounce, recoding a second consecutive weekly gain, as investors sought refuge from volatility in the wider markets. The yellow metal is being supported not only by a weaker U.S. dollar index, but also by safe-haven demand amid the escalating U.S.-Syria-Russia tensions. The minutes of the U.S. central bank’s last policy meeting on March 20-21 released Wednesday showed that policymakers felt the economy was continuing to get stronger and that the central bank remained on track to keep raising rates gradually. The Federal Reserve is expected to keep rates unchanged at its next policy meeting in May, but the markets are pricing in another rate hike at the following one in mid-June.
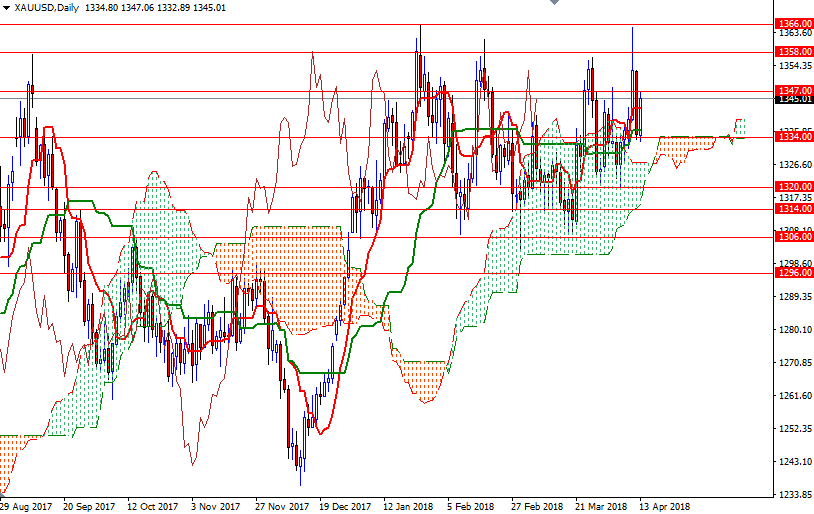
The long-term charts suggest that the bulls have the overall technical advantage, with the market trading above the weekly and the daily Ichimoku clouds. The Tenkan-Sen (nine-period moving average, red line) and the Kijun-Sen (twenty six-period moving average, green line) are positively aligned and the Chikou-span (closing price plotted 26 periods behind, brown line) is above prices. Despite this positive outlook, keep in mind that the upside potential will be limited until XAU/USD anchors somewhere above the strategic resistance at 1366. Once above 1366, we could possibly see the bulls make a run for 1375, which is the next key technical barrier on the charts. A sustained break above 1375 could prolong the bullish momentum and signal an extension to 1400.

If the bulls run out steam and prices fall back below 1334/2, we may pay another visit to the 1321/0 region. Closing below 1320 on a daily basis could trigger further weakness. In that case, the 1314 level will probably be the next port of call. A break below there could send prices back to the solid support in the 1308/6 area.


