The difference between success and failure in Forex trading is very likely to depend upon which currency pairs you choose to trade each week, and not on the exact trading methods you might use to determine trade entries and exits. Each week I am going to analyze fundamentals, sentiment and technical positions in order to determine which currency pairs are most likely to produce the easiest and most profitable trading opportunities over the next week. In some cases it will be trading the trend. In other cases it will be trading support and resistance levels during more ranging markets.
Big Picture 13th May 2018
In my previous piece last week, I forecasted that the best trades would be short GBP/USD and EUR/USD, as well as long Crude Oil. GBP/USD rose by 0.09%, EUR/USD fell by 0.18%, while Crude Oil rose by 1.07%, giving a good average win of 0.39%.
Last week saw a drop in the relative value of the U.S. Dollar, while other currencies were mixed. The U.S. stock market (represented by the S&P 500 Index) has broken bullishly out of a bearish consolidating triangle pattern but is not advancing strongly. Crude Oil has continued to rise to new long-term high prices, making another new 3-year high.
The major economic data release last week was weaker than expected U.S. inflation. This has had the effect of weakening the U.S. Dollar and boosting stock markets. There is no truly vital U.S. data due this week, with nothing important except retail sales data scheduled. This suggests that bearish sentiment on the greenback is likely to remain unchanged, but it still has a bullish trend.
Fundamental Analysis & Market Sentiment
Fundamental analysis tends to support the U.S. Dollar; but this may be contradicted by sentiment this week. The 10-year yield remains close to 3% but GDP looks strong.
Technical Analysis
U.S. Dollar Index
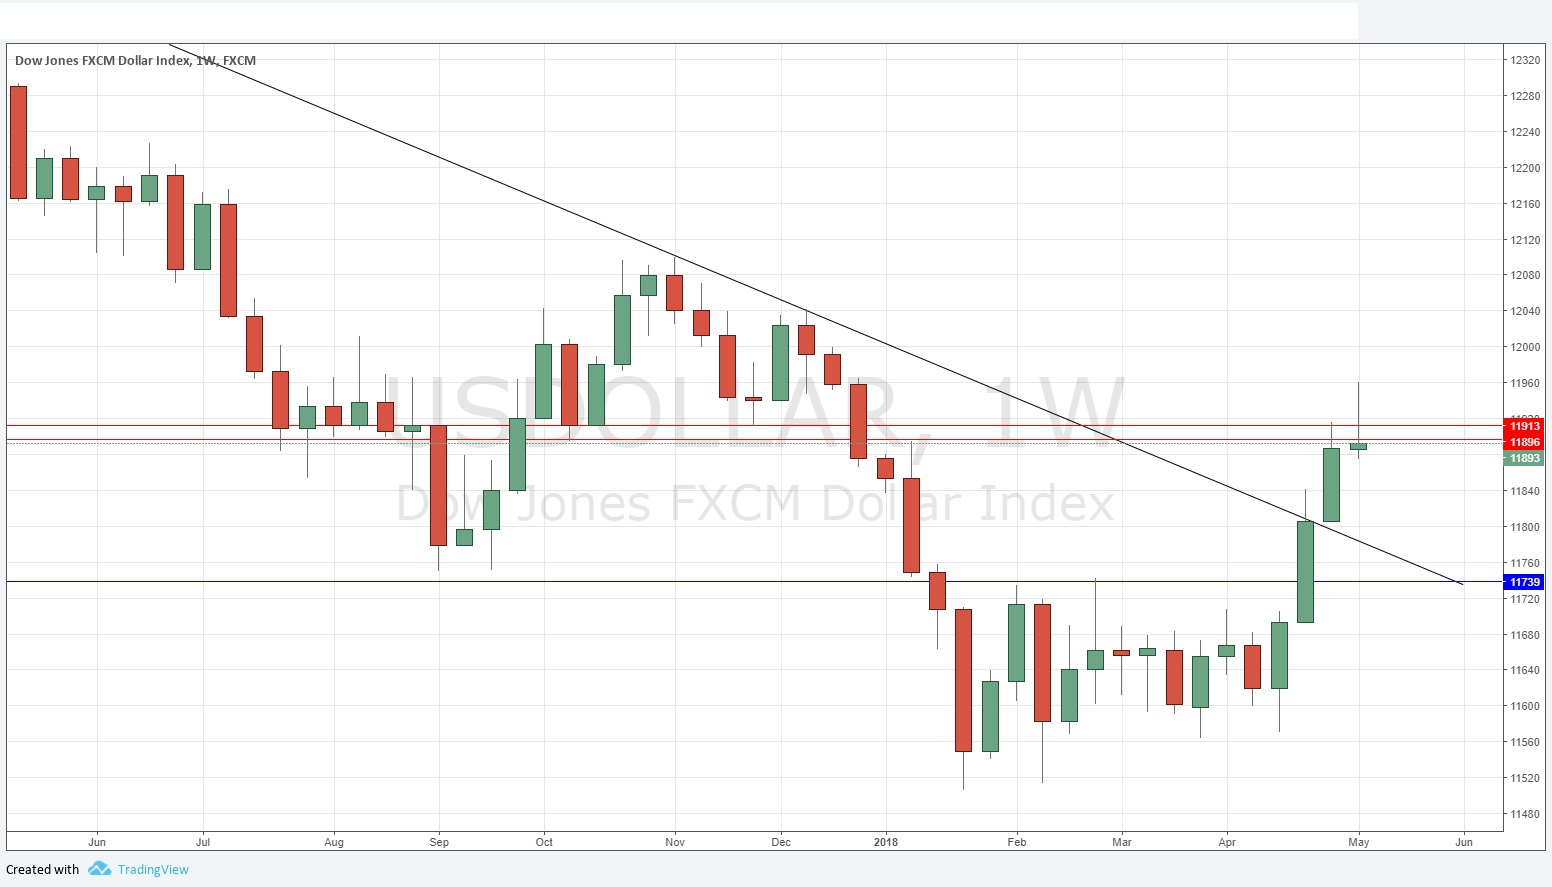
The weekly price chart below shows a bearish pin bar / candlestick move was made over the week, with the Index making a new 4-month high price and closing between its price levels from 3 months and 6 months ago, invalidating the long-term bearish trend, but rejecting the resistance levels of 11896 and 11913. This is a continuation of a major bullish technical change. The long-term bearish trend line has been decisively broken, but the price has now reached a zone of resistance which may contain it for a while at least.
SEK/JPY
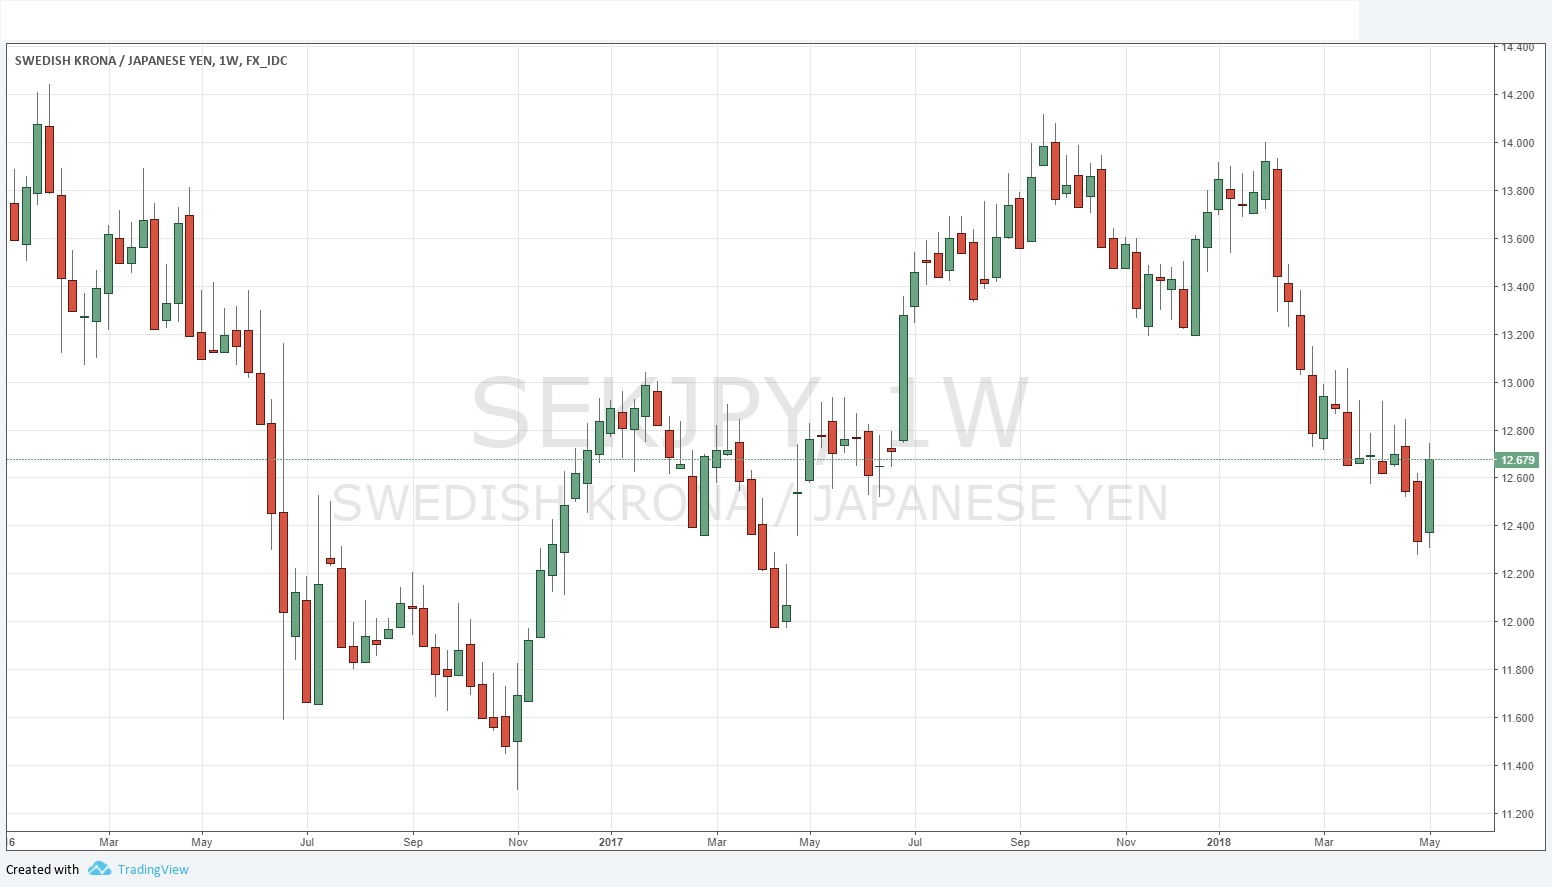
It is unusual for me to focus on such a relatively obscure currency cross, but the Swedish Krona has been in a long-term downwards trend against almost every other currency. This is partially due to its negative interest rate of -0.50%, as well as consistently worse than forecast inflation data releases. However, this week saw a sharp gain by the Krona as inflation finally came in as forecast. The Krona increased by more than 2% against its trend almost everywhere. In these situations, it is likely that the next week sees a move back in the direction of the original trend. I select the Japanese Yen as the bullish counterparty as it has the greatest long-term stability. This cross is likely to fall over the coming week. The major Forex currency pairs all look relatively unpredictable this week.
WTI Crude Oil
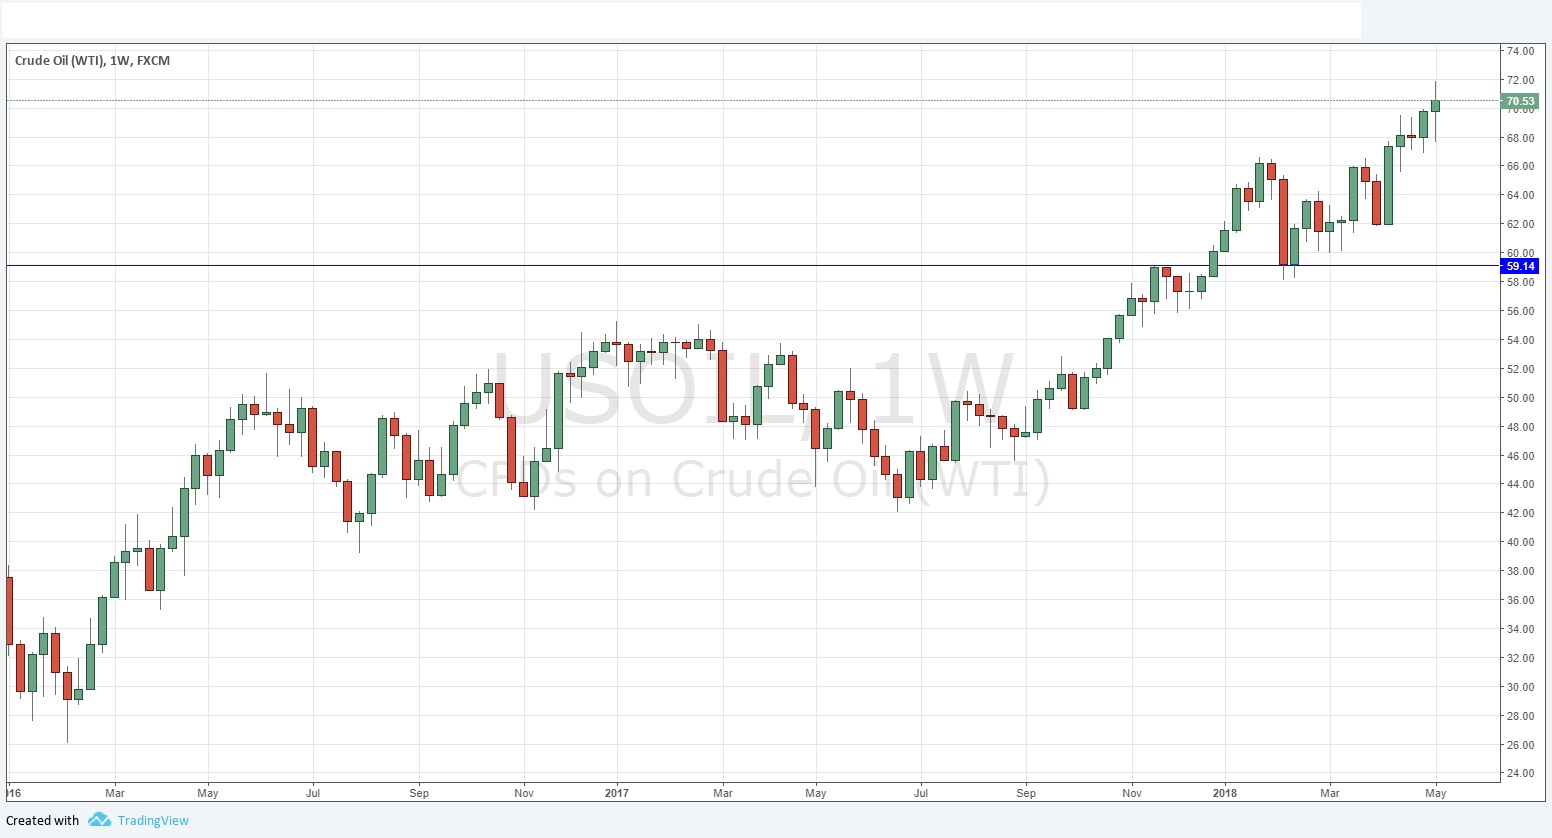
The weekly chart below shows the price again made a new 3-year high. There is a strong, long-term bullish trend here, although with tensions in the Middle East decreasing somewhat, there is greater chance of a bearish pull back. The candlestick also did not close near its high. However, there is still bullish momentum here, and it’s a respectable trend trade.
S&P 500 Index
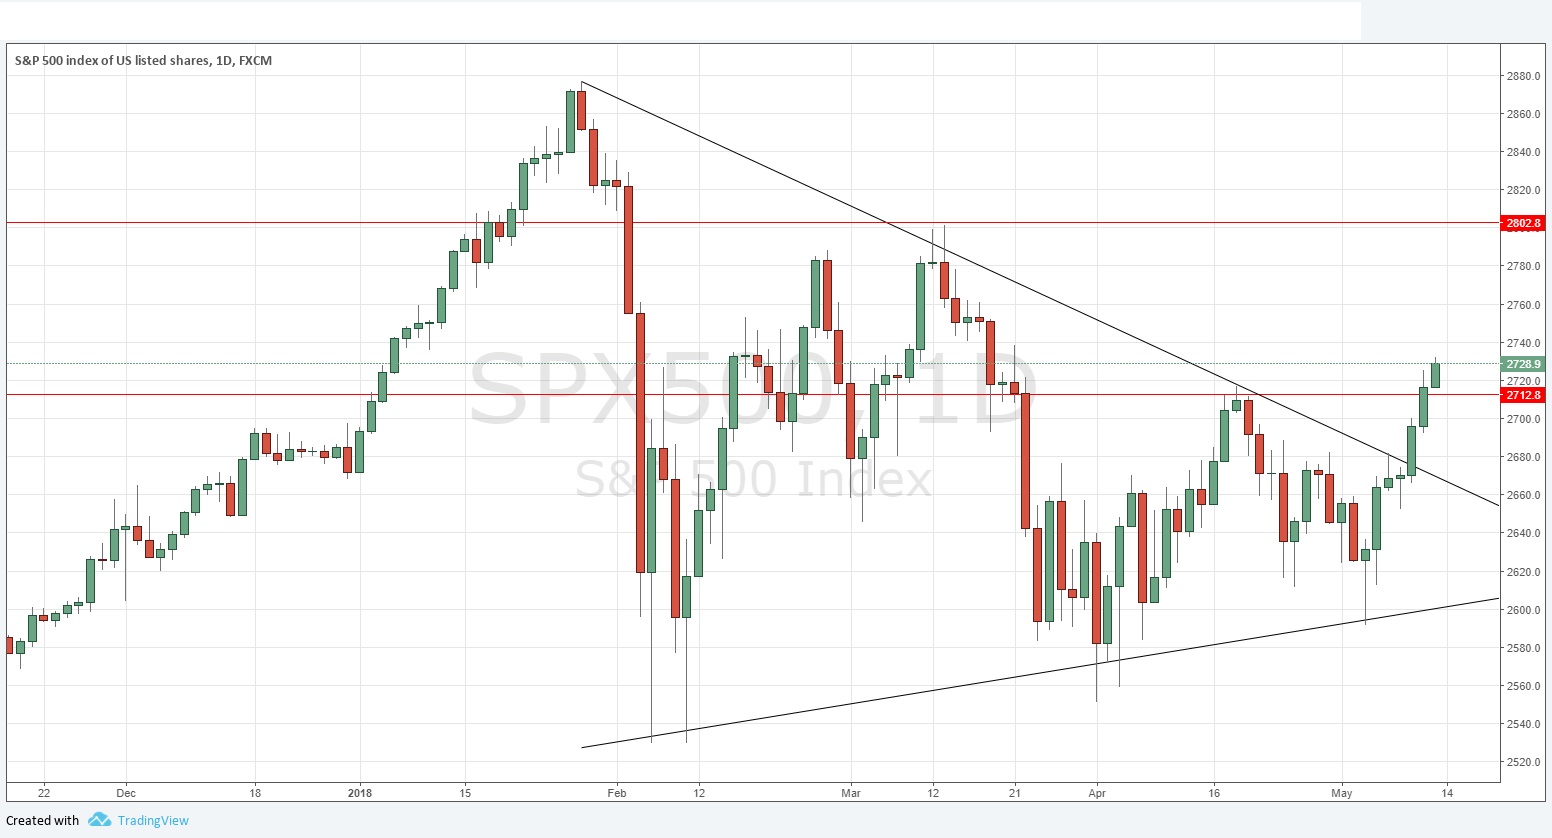
The daily chart below shows the price has finally broken bullishly out of its consolidating triangle formation after a third tap on the supportive area confluent with the 200-day simple moving average. A resistance level was also broken, and the move has a strong quality. It looks more likely than not to continue over the next week.
Conclusion
Bearish on SEK/JPY; bullish on WTI Crude Oil and the S&P 500 Index.


