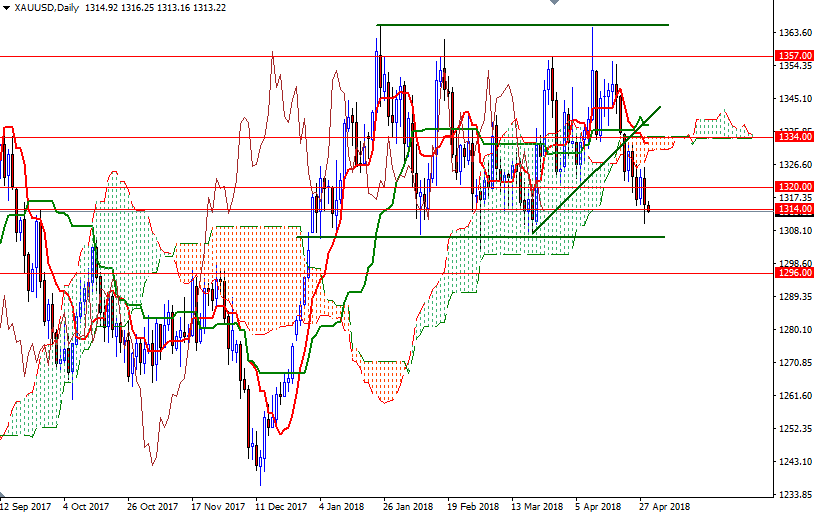
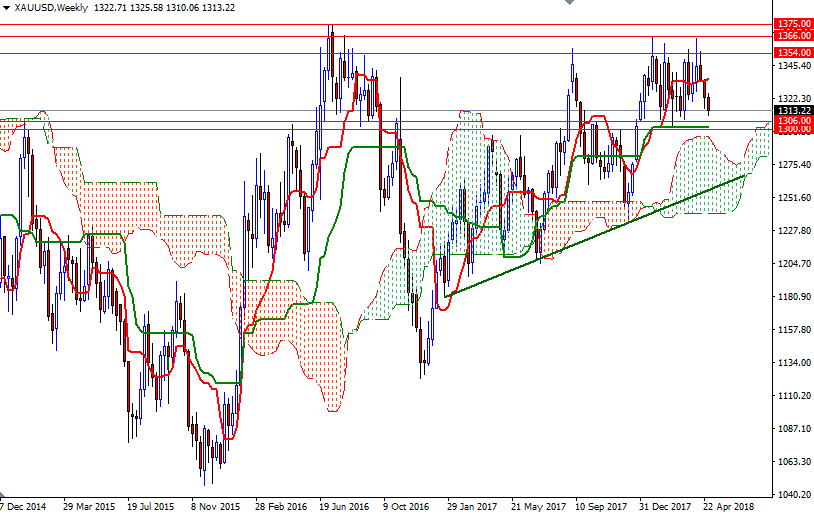
The market started the week on the back foot, suffering a loss of $7.53 an ounce, as the dollar’s strength continued to put downward pressure on the price of the precious metal. Some chart-based selling was also behind gold’s 0.57% drop yesterday. A failure to break through the resistance in the $1326.50-$1325.60 area encouraged sellers. World stock markets were mostly firmer yesterday while U.S. stocks edged lower. This week sees a deluge of U.S. economic data, including the monthly non-farm payrolls report. The Federal Reserve’s Open Market Committee (FOMC) meeting that kicks off today will also have the attention of the world marketplace.
Although the long-term outlook is still bullish, the short-term chars indicate that the bears have the overall technical advantage. The market is trading below the Ichimoku clouds on both the daily and the 4-hourly charts. The Tenkan-Sen (nine-period moving average, red line) and the Kijun-Sen (twenty six-period moving average, green line) lines are negatively aligned. Down below, we that the key technical support in the 1308/6 zone. If this support is broken, the market will be targeting 1300-1296. Closing below 1296 on a daily basis opens up the risk of fall to 1261, the ascending trend line.
To the upside, the initial resistance sits at 1318, followed by 1322/0, the area occupied by the hourly cloud. The bulls have to lift price above the 1326.50-1325.60 area if they don’t intend to give up. A daily close above there paves the way for a test of 1336/4 as it suggests a short-term bottom is in place.


