By: DailyForex
Gold prices settled at $1300.62 an ounce on Friday, rising nearly 0.82% over the course of the week, as souring relations between the United States and North Korea put geopolitics right back on the front burner of the marketplace and prompted a wave of short-covering. Concerns about the impact of a major U.S.-China trade dispute that remains unresolved also resurfaced after U.S. President Trump announced a national security investigation into imports of cars, trucks and auto parts, a probe that could lead to an additional tariff on vehicles of up to 25 percent. The minutes of the Federal Open Market Committee’s latest policy meeting suggested that inflation above the Fed’s target may not necessarily mean a faster rate of hikes. However, the records cemented the fact that we are going to get another rate hike at the next meeting on June 12-13. The appreciating greenback has been a major factor working against gold over the past few weeks.
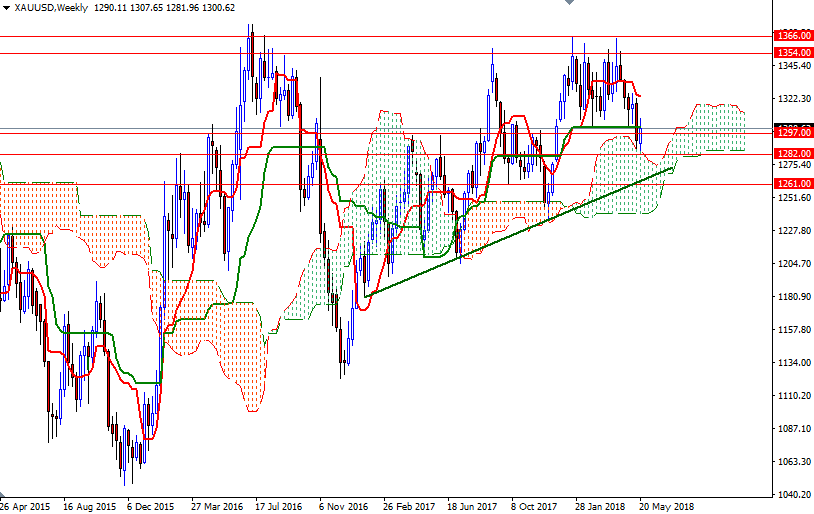
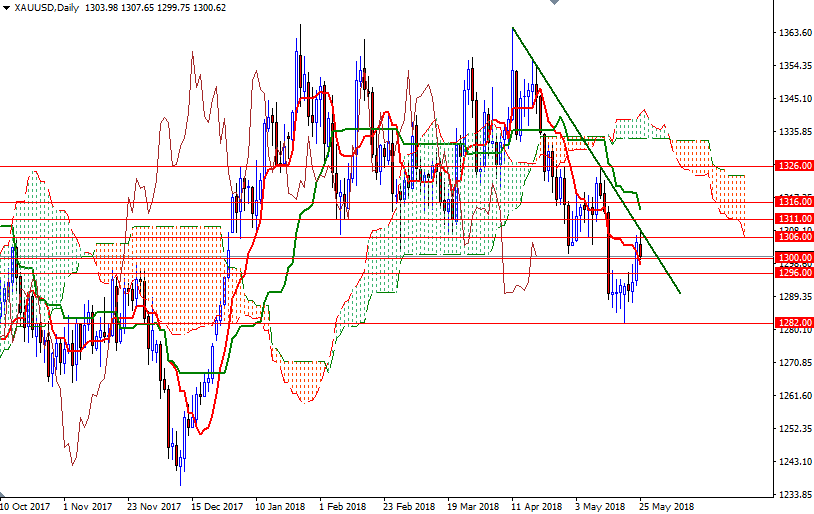
From a chart perspective, the bulls still have the long-term technical advantage, with the market trading above the weekly Ichimoku cloud. However, the near-term outlook still remains bearish as prices reside below the daily cloud (XAU/USD still in a seven-week-old downtrend on the daily chart). Technically, Ichimoku clouds not only identify the trend but also represent support and resistance zones. The thickness of the cloud is also relevant as it is more difficult for prices to break through a thick cloud than a thin cloud.
To the upside, the initial resistance sits in the 1307.50-1306 area. If the bulls want to take the reins back, they will need to push prices convincingly above 1307.50, which also happens to be the 200-day moving average. In that case, they will have a chance to challenge 1311 or even 1318/6. Beyond there, the 1326/3 zone stands out as a solid technical resistance. Clearing this barrier could encourage buyers and open the door to 1336/4. On the other hand, if the bears increase the downward pressure and drag prices below 1296, then look for further downside with 1292.50 and 1287.40-1286 as targets. The bears have to produce a daily close below key support in 1282/1 (the top of the weekly cloud) to gain momentum for 1277/4. A break down below 1274 indicates that the bears are on their way to 1265.


