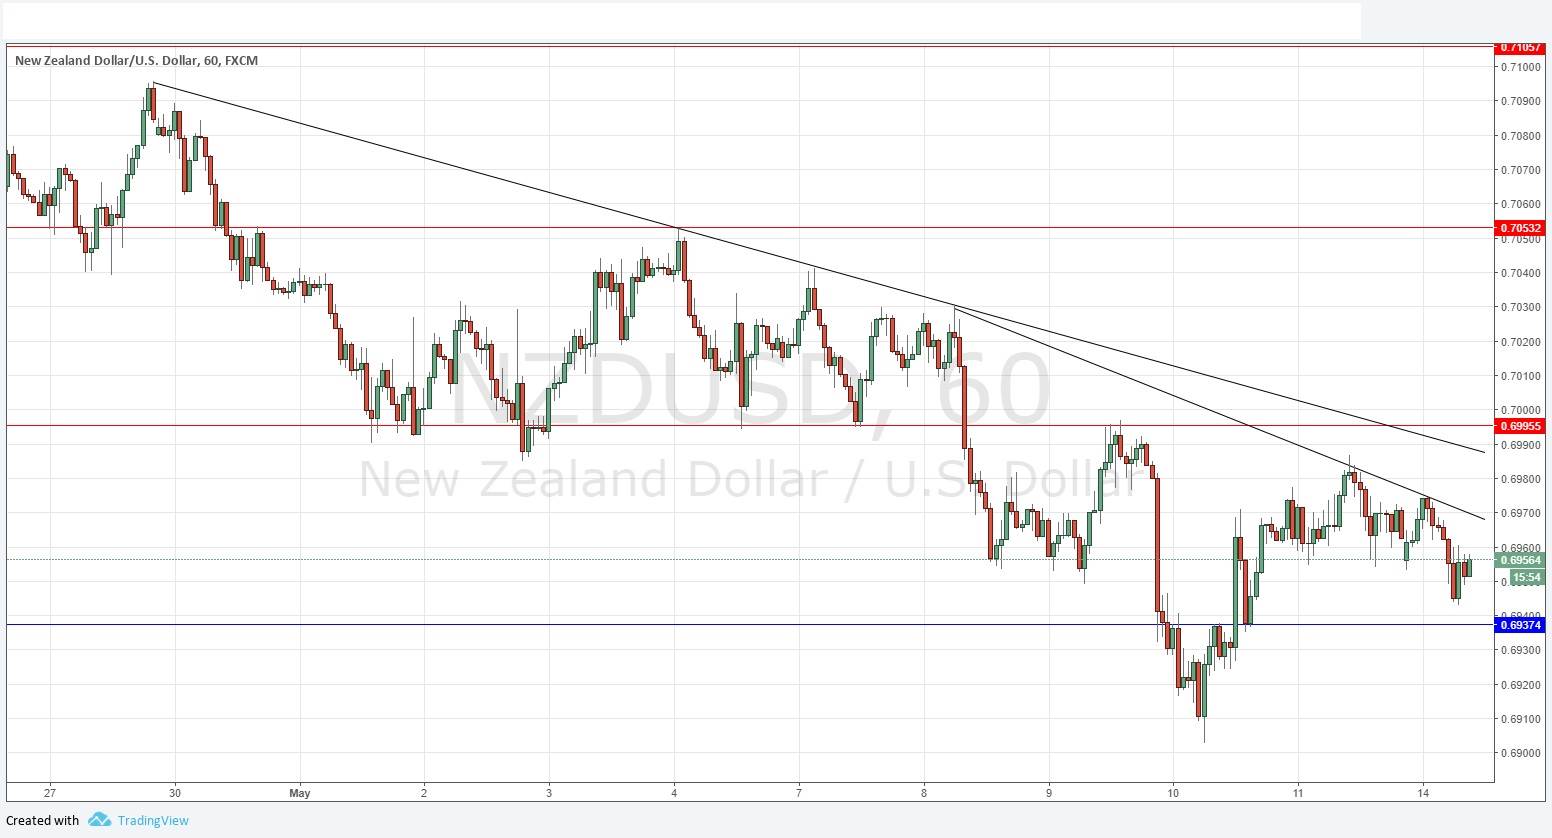
Last Thursday’s signals were not triggered, as there was no bearish price action at 0.6945.
Today’s NZD/USD Signals
Risk 0.50%.
Trades may only be entered between 8am New York time and 5pm Tokyo time, during the next 24-hour period.
Short Trades
Go short following a bearish price action reversal on the H1 time frame immediately upon the next touch of 0.6996.
Put the stop loss 1 pip above the local swing high.
Move the stop loss to break even once the trade is 20 pips in profit.
Take off 50% of the position as profit when the trade is 20 pips in profit and leave the remainder of the position to ride.
Long Trade
Go long following some bullish price action on the H1 time frame immediately upon the next touch of 0.6937.
Put the stop loss 1 pip below the local swing low.
Move the stop loss to break even once the trade is 20 pips in profit.
Take off 50% of the position as profit when the trade is 20 pips in profit and leave the remainder of the position to ride.
The best method to identify a classic “price action reversal” is for an hourly candle to close, such as a pin bar, a doji, an outside or even just an engulfing candle with a higher close. You can exploit these levels or zones by watching the price action that occurs at the given levels.
NZD/USD Analysis
Last Thursday I was firmly bearish on this pair. While I probably was right over the longer term, I have been definitely wrong over the short term, as the price has risen and printed new, higher support at 0.6937. However, the picture shown in the price chart below still looks bearish, with two very dominant bearish trend lines suppressing the price. The area just below 0.7000 looks v3ry attractive for a potential short trade set-up due to the confluence of the trend lines, resistance, and the major round number at 0.7000. I think the price is likely to fall further over the coming days, as the New Zealand Dollar is generally relatively very weak.
There is nothing due today concerning either the NZD or the USD.

