USD/JPY
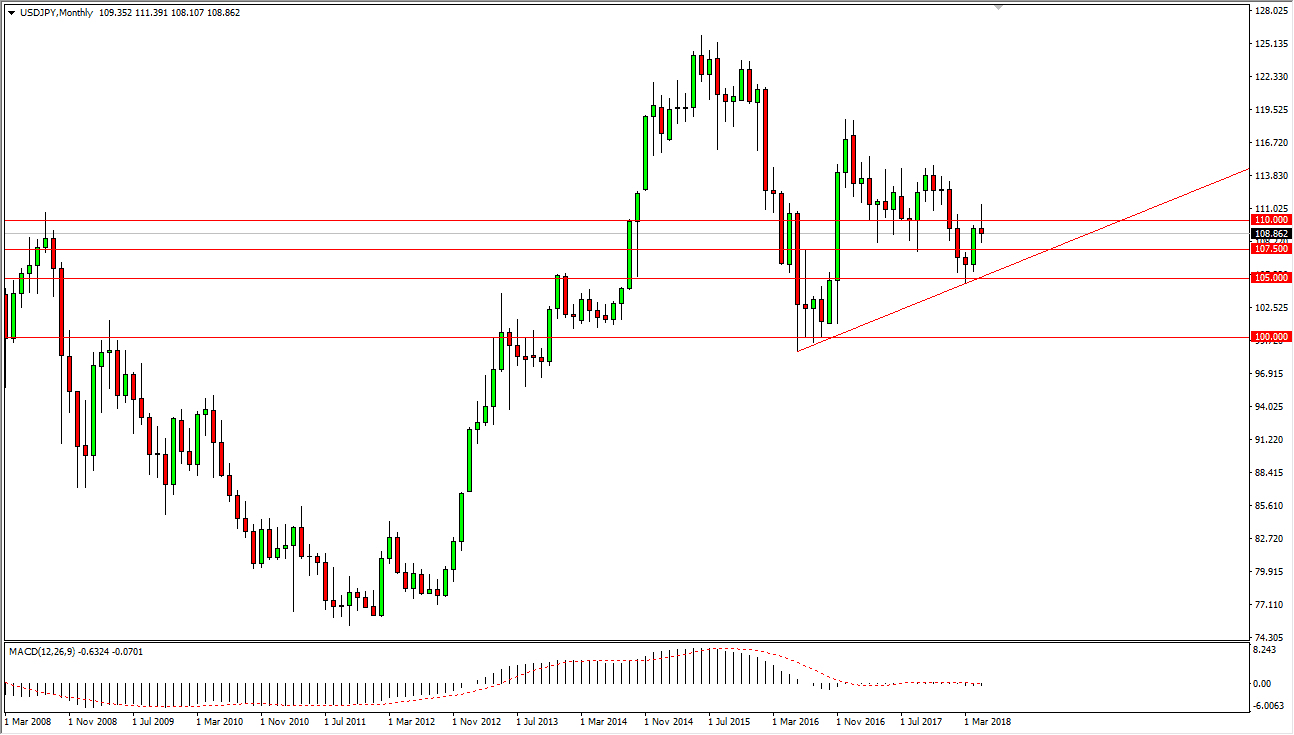
The US dollar has gone back and forth during the trading sessions that make up the month of May, bouncing around in a relatively tight range. The candle for the month of May ended up being a shooting star, which of course is a very negative sign. I think that the market breaking above the top of the candle would be an extraordinarily bullish sign, and that should send this market towards the ¥115 level. However, this is a very negative sign and I think it’s likely that we will fall towards the ¥107.50 level, and then perhaps a break down below there could send this market towards the uptrend line that I have marked on the chart. This pair is highly sensitive to risk appetite around the world, so if we start to see some type of serious issue, this will be one of the first places that struggle in the currency markets.
That being said, I believe that the uptrend line will hold, at least over the next month or so, so I think that what we are looking at is a situation where we are simply going to go back and trying to test that uptrend line. Obviously, if we break above the top of the shooting star that would be a very positive sign as it would show significant resistance broken. Anytime the markets break the top of the shooting star on a monthly chart, that’s a major sign of bullish pressure, so I would be very interested in taking a trade for longer-term move. If we break down below the uptrend line, I would be very short of this pair, expecting a return to the parity level which we have last visited during spring of 2016. I think this month could be very interesting to say the least.

