BTC/USD
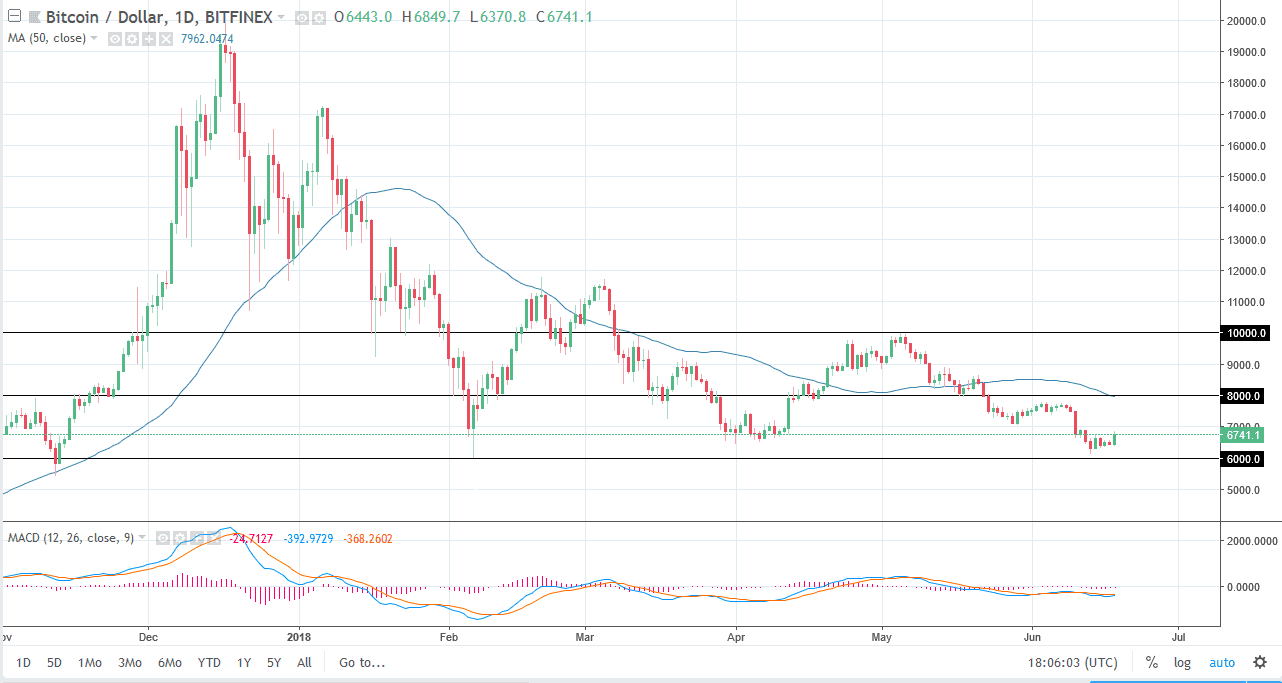
Bitcoin rallied a bit during the trading session on Monday as traders came back to work, gaining almost 5%. That’s a very positive turn of events but when you zoom out look at the daily chart, you can see that although impressive for the day, in the big scheme of things it is but a blip. The $8000 level above is what I would consider to be the short term “ceiling” in the market, which coincides nicely with the 50 SMA. I also look at the $6000 level as a major support level, so if we were to turn around and break down through that level, it would be a huge sell signal. Recently, we continue to see lower highs, which of course is a very negative sign as well. It does not take much imagination to look at this chart and think about a descending triangle which could spell serious trouble. At this point, I still look for exhaustive candle to start selling.
BTC/JPY
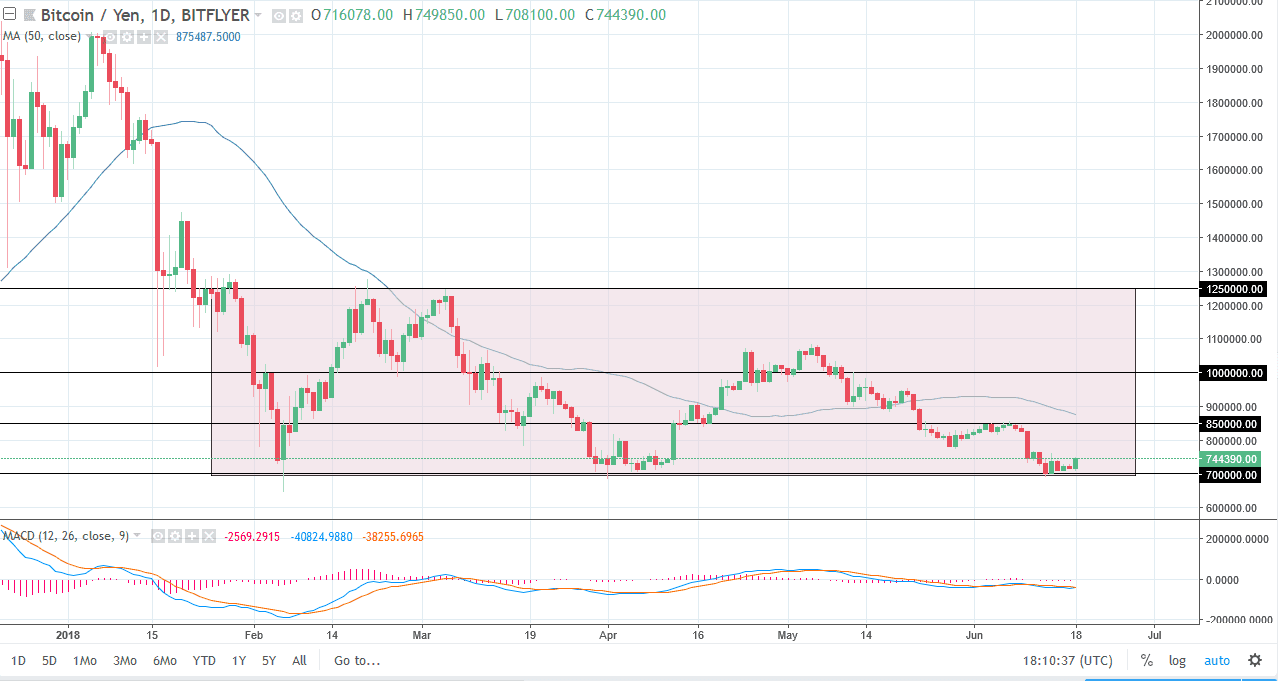
Bitcoin also rallied against the Japanese yen in quite handily. We have bounced from the ¥700,000 level, an area of major support. It is the bottom of the overall consolidation, and an area that has held as a “triple bottom” so far. However, if we were to break down below that level, it could unwind the market down to the ¥600,000 level. Otherwise, we could get a bit of a bounce, but I recognize the ¥850,000 level should be significant resistance. If we find signs of exhaustion near that level, I would be more than willing to start selling again. If we broke above there, then we could go as high as ¥1 million. However, things still look as if they are in a “sell the rallies” mode when trading Bitcoin against the Japanese yen.


