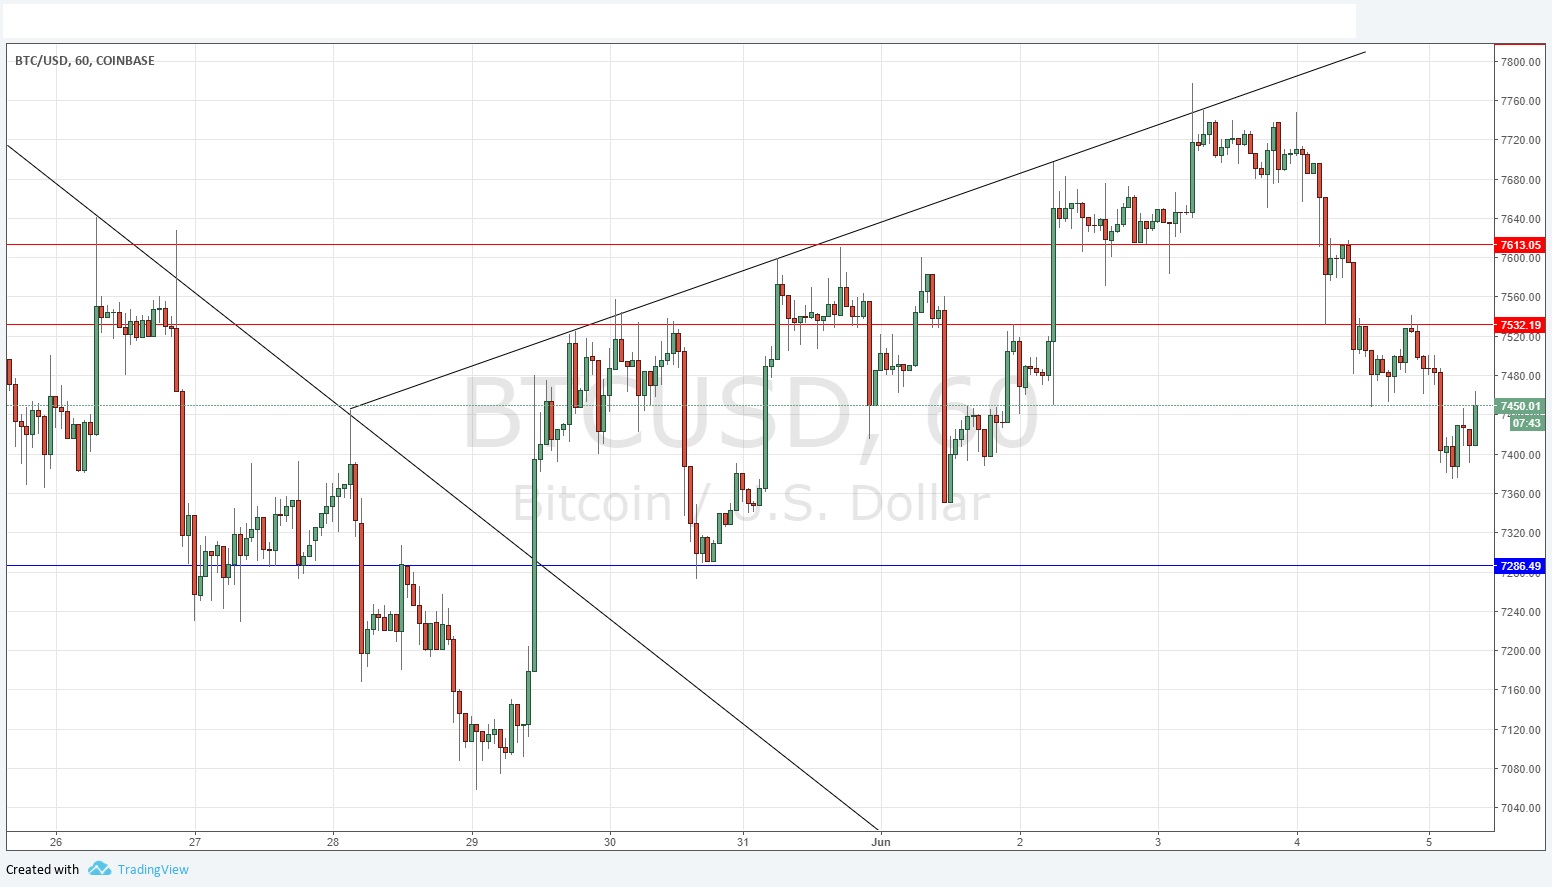
Yesterday’s signals were not triggered, as there was no bullish price action at $7,287.
Today’s BTC/USD Signals
Risk 0.75% per trade.
Trades must be entered before 5pm Tokyo time today, over the next 24-hour period only.
Long Trades
Go long after a bullish price action reversal on the H1 time frame following the next touch of $7,287.
Put the stop loss 1 pip below the local swing low.
Adjust the stop loss to break even once the trade is $200 in profit by price.
Take off 50% of the position as profit when the trade is $200 in profit by price and leave the remainder of the position to ride.
Short Trade
Go short after a bearish price action reversal on the H1 time frame following the next touch of $7,532 or $7,613.
Put the stop loss 1 pip above the local swing high.
Adjust the stop loss to break even once the trade is $200 in profit by price.
Take off 50% of the position as profit when the trade is $200 in profit by price and leave the remainder of the position to ride.
The best method to identify a classic “price action reversal” is for an hourly candle to close, such as a pin bar, a doji, an outside or even just an engulfing candle with a higher close. You can exploit these levels or zones by watching the price action that occurs at the given levels.
BTC/USD Analysis
Yesterday I was bullish above $7,352 and bearish below that. This worked out very well, with the level breaking down quickly and then becoming resistance with an obvious flip. You could even have used this same level for a good, profitable short trade entry. The technical picture now is a little more bearish, but we have still not broken below any of the key higher swing lows which you can see in the price chart below, so I have no directional bias today. The likely next short-term movement looks very 50-50 to me, which is another indication of how Bitcoin is starting to trade more like a conventional Forex currency pair!
Regarding the USD, there will be a release of ISM Non-Manufacturing PMI data at 3pm London time.
