Gold prices settled at $1293.25 an ounce on Friday, falling 0.42% on the week and 1.27% over the month. The strength in the U.S. dollar and keener risk appetite, which continues to support buying interest in equities, have been major bearish elements for the precious metal in recent weeks. A number of Fed policymakers stressed that they would tolerate inflation rising above the Fed’s goal for a while. The latest jobs report released Friday strengthened the case for a June rate hike, but we will have to wait until this month’s meeting for a clue on whether there will be two or three rate hikes this year.
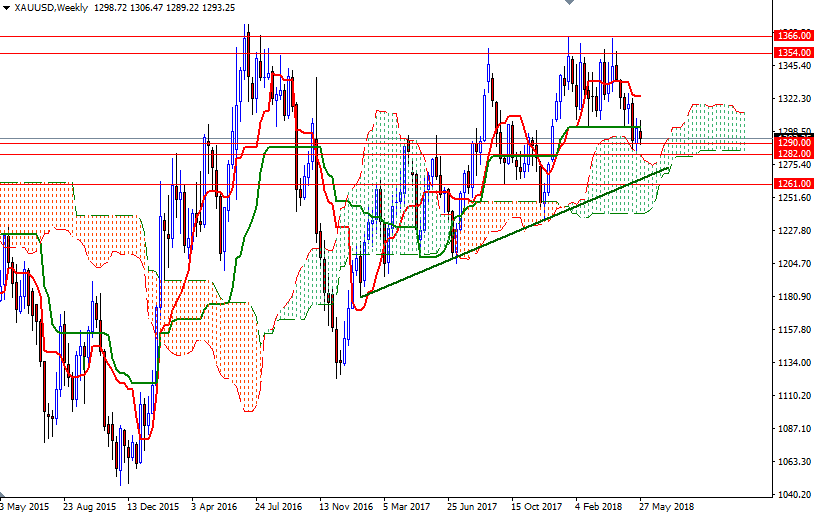
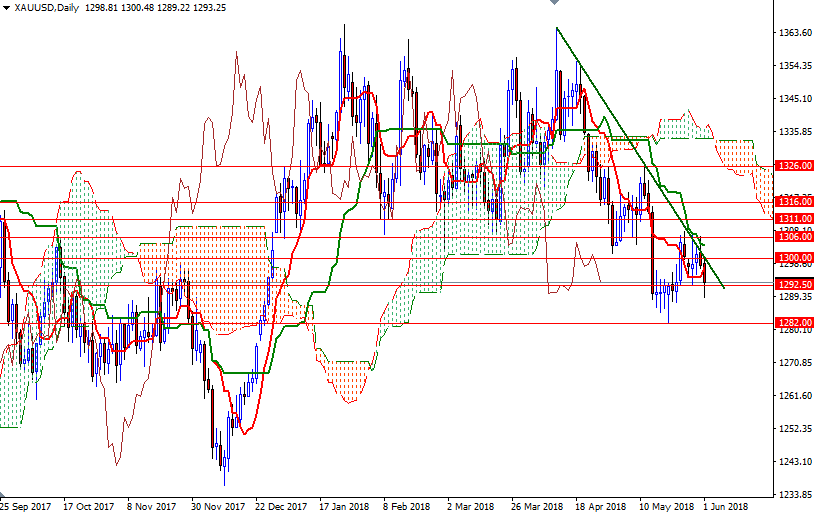
Trading above the Ichimoku clouds on the weekly chart, along with the positively aligned Tenkan-sen (nine-period moving average, red line) and Kijun-sen (twenty six-period moving average, green line), suggests that the bulls have the long-term technical advantage. However, XAU/USD is still below the daily cloud. In addition to that, a seven-week-old downtrend on the daily chart hasn’t been negated yet. These suggest more pressure in the near term, and the strategic support in the 1282/1 area is still in danger. From a technical standpoint, further weakness below 1281 could encourage a selloff lower towards 1261.On its way down, support can be seen in 1277/4 and at 1265. A weekly close below 1261 is essential for a bearish continuation to 1252.
To the upside, the first important hurdle gold needs to jump is located in the 1307.50-1306 area, where the daily Kijun-Sen and 200-day moving average converge. A sustained rally above 1307.50 would be needed to give the bulls short-term confidence. In that case, look for further upside with 1311 and 1318/6 as targets. Closing above 1318 on a daily basis could offer enough inspiration for the bulls to send prices higher towards the daily Ichimoku cloud. If XAU/USD successfully penetrates the solid technical resistance in the 1326/3 area (a sign of a strong bullish recovery), then 1333/1 and 1340/37 will be the next targets.


