By: DailyForex
The difference between success and failure in Forex trading is very likely to depend upon which currency pairs you choose to trade each week, and not on the exact trading methods you might use to determine trade entries and exits. Each week I am going to analyze fundamentals, sentiment and technical positions in order to determine which currency pairs are most likely to produce the easiest and most profitable trading opportunities over the next week. In some cases it will be trading the trend. In other cases it will be trading support and resistance levels during more ranging markets.
Big Picture 10th June 2018
In my previous piece last week, I forecasted that the best trades would be long USD/MXN, USD/SEK, and USD/TRY above certain high points. The only pair which did break a relevant high price and trigger an entry was USD/MXN, which closed up by 1.12% from the previous week’s high, giving a profitable trade result.
Last week saw a rise in the relative value of the Euro, while the Mexican Peso, U.S. Dollar and Japanese Yen were the major declines. The U.S. stock market rose a little and closed bullishly, very close to a new 2-month high price. Crude Oil fell again.
The major event of last week was the weekend’s G7 meetings, and there was not much central bank input of important economic data during the week, which had the result of making last week’s movements very small.
Fundamental Analysis & Market Sentiment
Fundamental analysis tends to support the U.S. Dollar, as American economic fundamentals continue to look strong. The weakest and most vulnerable currencies remain the Mexican Peso (due to the tariff dispute and current Mexican election opinion polls), as well as the South African Rand (due to a general weakness in emerging markets). I would be interested in USD/MXN and USD/ZAR long above last week’s respective high prices. I also have an eye on short GBP/USD, but the price will have to drop by a considerable distance before that would start to look interesting.
The week ahead is likely to have a lot of high-impact events that should produce a surge in volatility. There will be central bank guidance from the Federal Reserve, the European Central Bank, and the Bank of Japan, as well as U.S. and British inflation data, and probable further decisions on tariffs as the trade war continues. These events might produce strong and surprising price movements, and lead to changes in technical outlooks.
Technical Analysis
U.S. Dollar Index
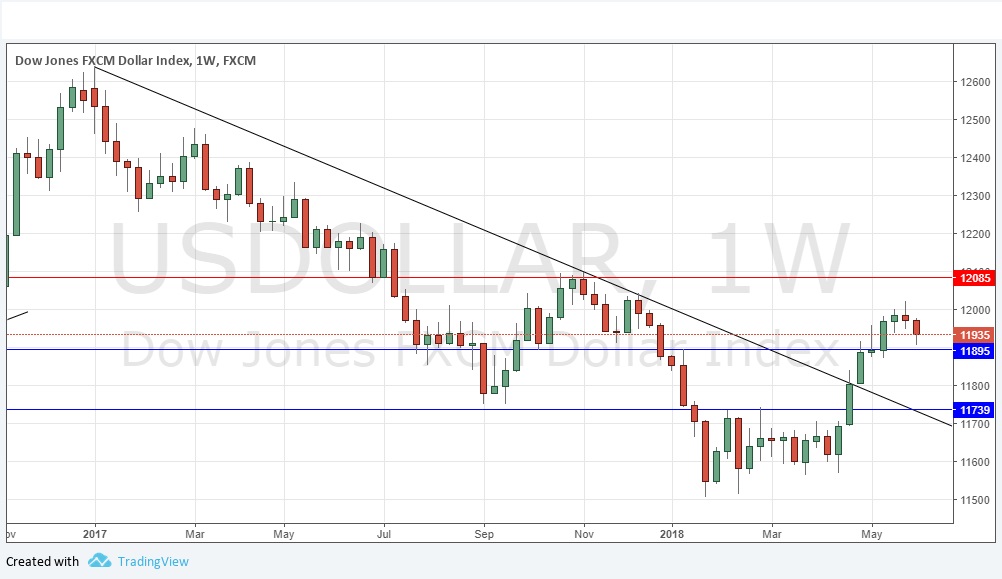
The weekly price chart below shows an average sized bearish bar / candlestick move was made over the week, with the Index remaining above its price level from 3 months ago but not and 6 months ago, sitting in a reasonably long-term bullish trend. The candlestick might be said to be bearish, but, it is better described as relatively inconclusive due to its fairly large lower wick rejecting a level close to the support at 11895. So, the trend is bullish, but there may not be much momentum left in the short-term.
USD/MXN
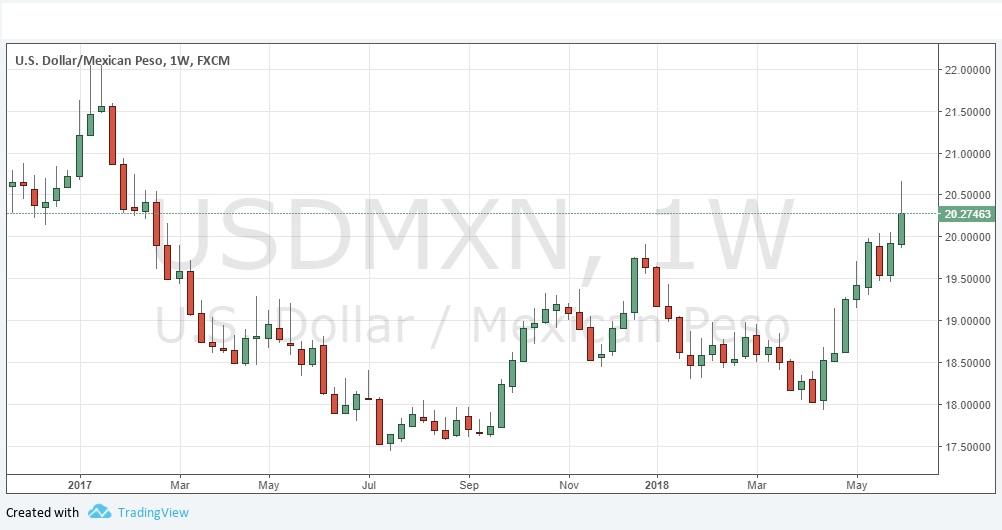
The Dollar has advanced beyond 20 Mexican Pesos over the past week, rising strongly. The price had been trading in relative “blue sky” before dropping sharply on Friday, but still ended the week well up. The large upper wick is a little concerning, so we should want to see the price make a new high above last week’s before being ready to enter a long trade. There is also a suggestion from the chart that the 20.50 could be a resistant area as it was previously somewhat inflective.
USD/ZAR
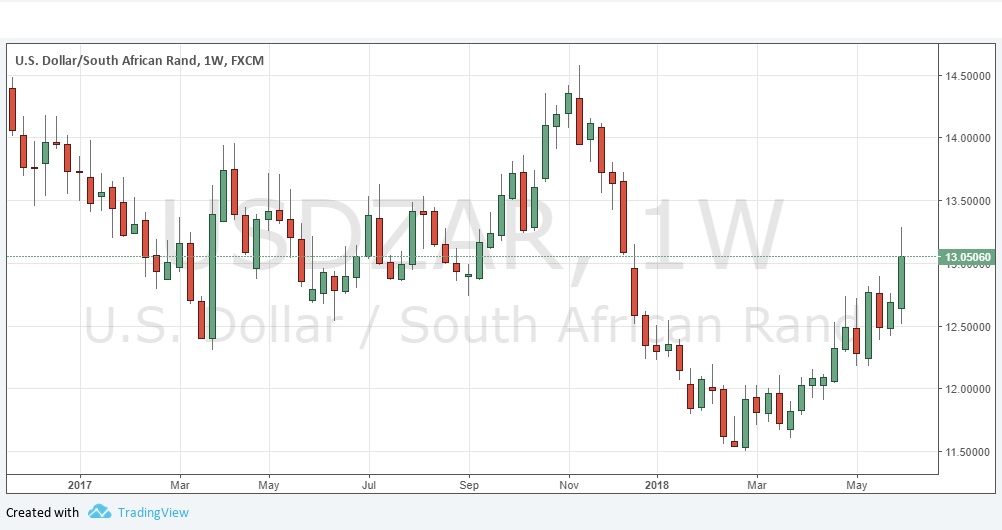
The Dollar rose quite strongly against the South African Rand last week. The price had been trading in relative “blue sky” before dropping sharply on Friday, but still ended the week well up. The large upper wick is a little concerning, so we should want to see the price make a new high above last week’s before being ready to enter a long trade. There is also a suggestion from the chart that the 13.23 could be a resistant area as it was previously somewhat inflective.


