The difference between success and failure in Forex trading is very likely to depend upon which currency pairs you choose to trade each week, and not on the exact trading methods you might use to determine trade entries and exits. Each week I am going to analyze fundamentals, sentiment and technical positions in order to determine which currency pairs are most likely to produce the easiest and most profitable trading opportunities over the next week. In some cases it will be trading the trend. In other cases it will be trading support and resistance levels during more ranging markets.
Big Picture 15th July 2018
In my previous piece last week, I forecasted that the best trades would be long Crude Oil (above the previous week’s high price), and long EUR/USD. This worked out badly, with WTI Crude Oil failing to exceed its previous week’s high price, and EUR/USD falling by 0.49%. This produced an average loss of 0.25%.
Last week saw a rise in the relative value of the Australian and U.S. Dollars, and a fall in the relative value of the Japanese Yen.
The market is still quiet, indecisive, and relatively difficult to trade profitably right now.
The major event of last week was lower than expected U.S. inflation data, although this cannot be said to have made a major impact upon the U.S. Dollar yet. It is currently difficult to gauge market sentiment although the U.S. stock market’s benchmark index, the S&P 500, last week reached its highest price since January.
Fundamental Analysis & Market Sentiment
Fundamental analysis tends to support the U.S. Dollar, as American economic fundamentals continue to look relatively strong. The Japanese Yen has come to life this week, falling strongly. The British Pound made some sharp moves on President Trump’s comments regarding Brexit and a U.S./U.K. trade deal but remained largely range-bound.
The week ahead will probably be dominated by the release of U.S. retail sales data, and testimony by the Chair of the Federal Reserve before Congress on monetary policy.
Technical Analysis
U.S. Dollar Index
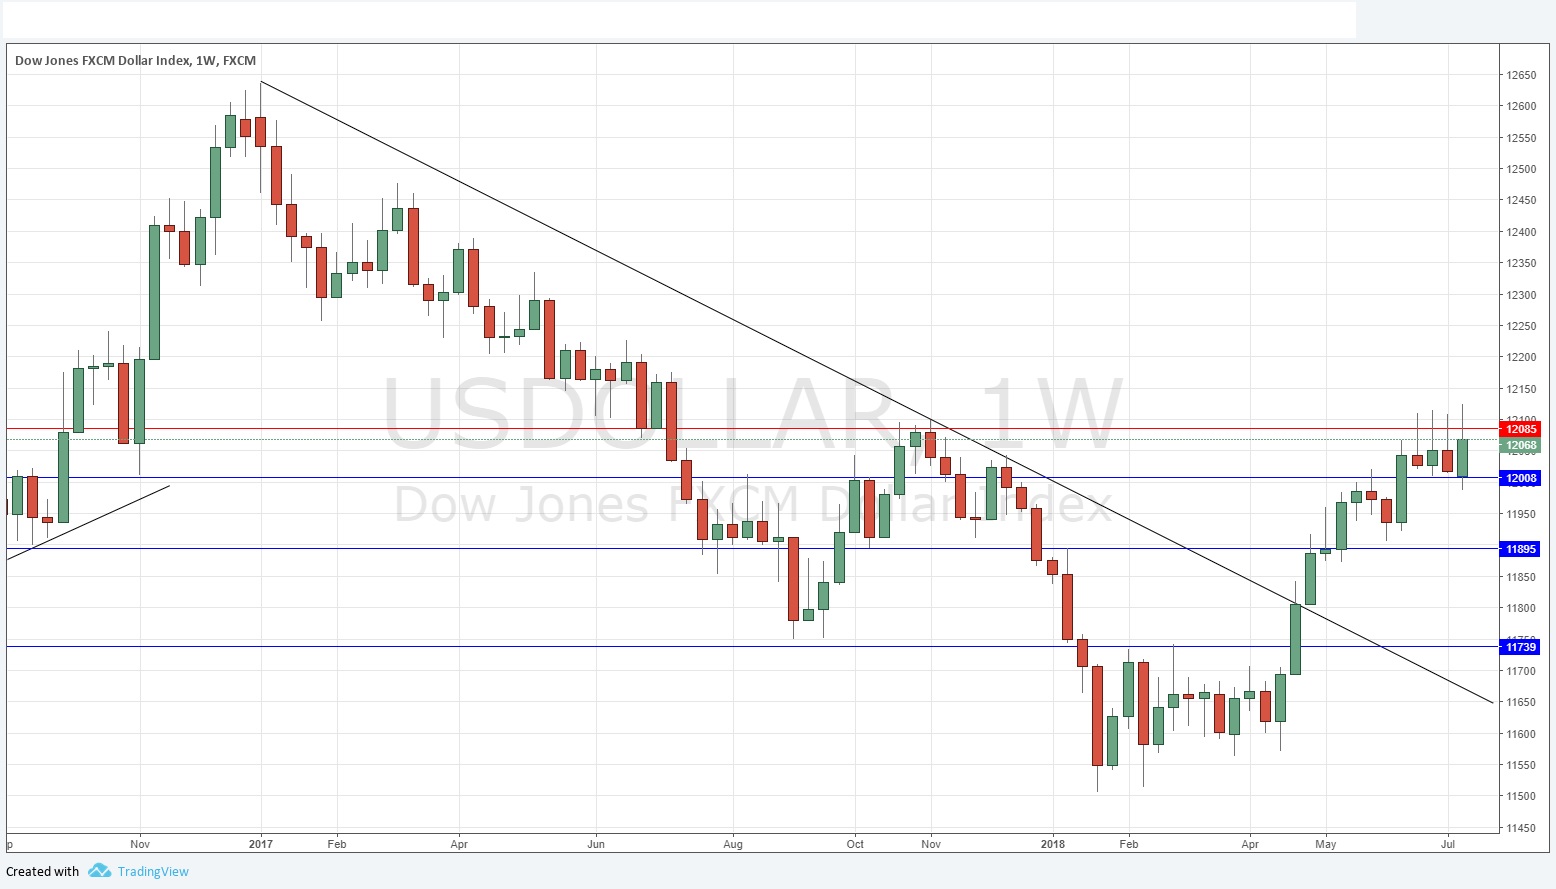
The weekly price chart below shows that for the fourth week running, the U.S. Dollar Index has ranged between 12085 and 12008, suggesting indecision. However, the past week’s candlestick is bullish, albeit with a large upper wick, and the Index is clearly in a long-term bullish trend. This suggests that the outlook for the U.S. Dollar is cautiously bullish.
USD/JPY
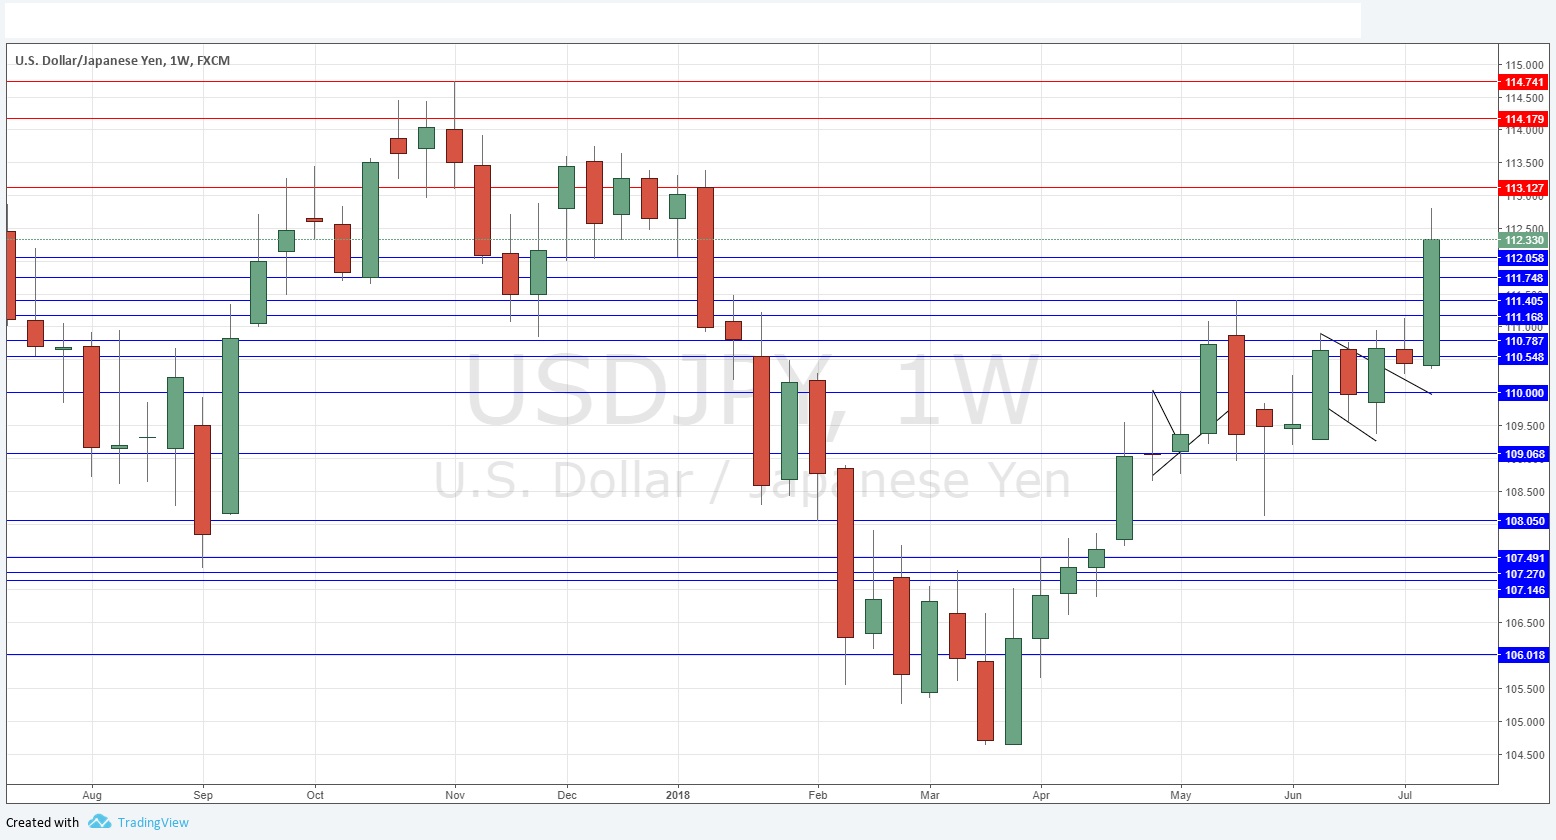
After ranging for several weeks, albeit within a technical upwards trend, last week saw this pair break out very bullishly and make its strongest weekly rise for many months. The price has made a new 6-month high. It is true that the bullish trend is not steady, and that the weekly candlestick has a reasonably large upper wick, but the indications are that the price is likely to continue to rise for a while.
S&P 500 Index
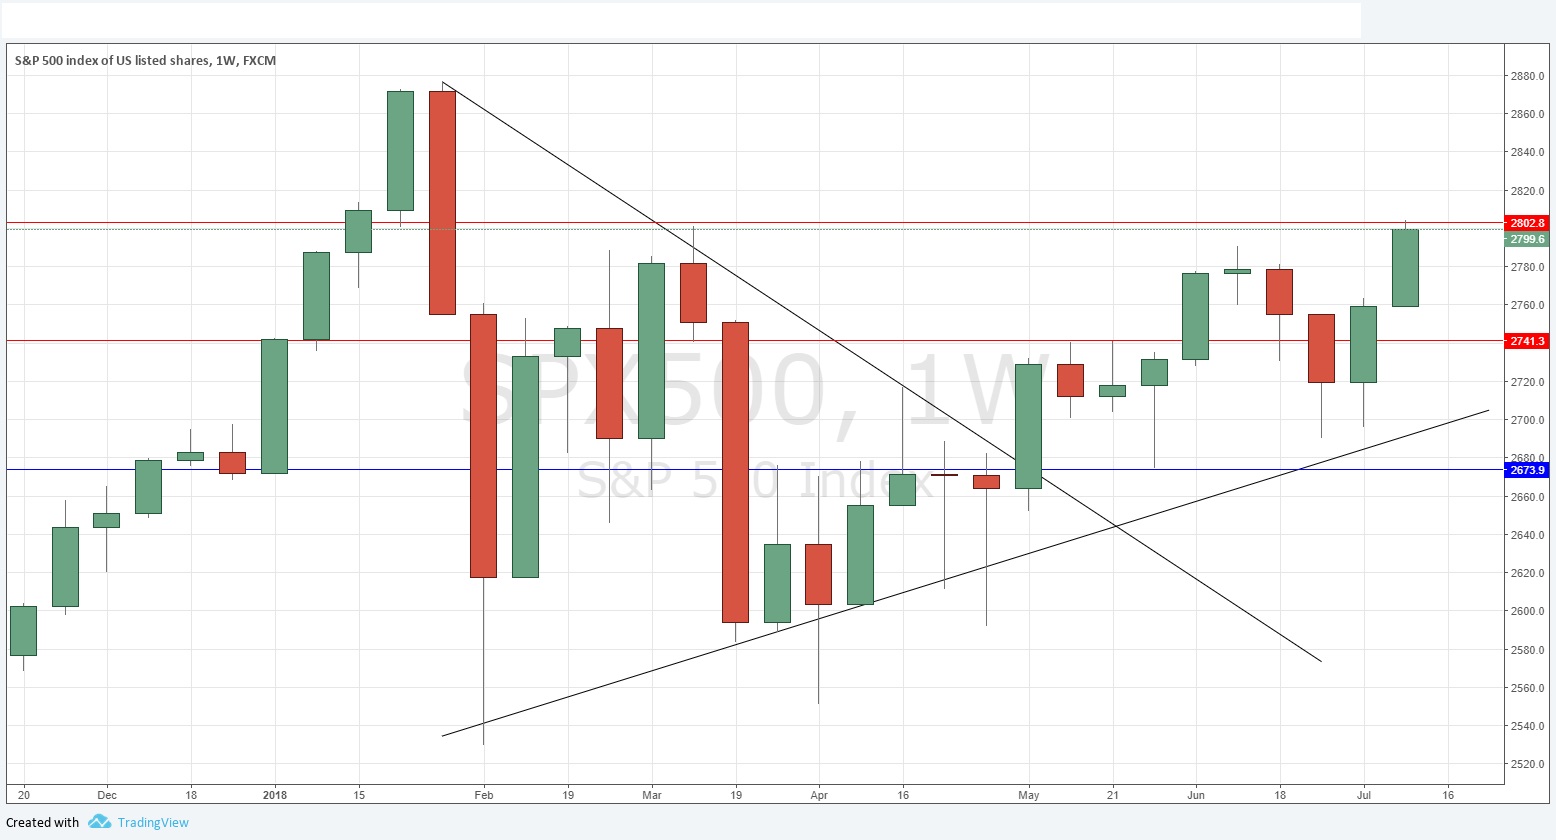
The past six months have been choppy for the U.S. stock market, but the 200-day moving average has held even when the market was beginning to look very bearish. Last week saw a strong rise, which has challenged that key resistance level shown in the price chart below at 2803. If the price can break strongly above last week’s high, we could see a firm continuation of the bullish movement last week. However, any bad news on trade or tariffs can sink the market in an instant, so it is important to either be very careful, or to take a long-term investment approach.
Conclusion
Bullish on the USD, bearish on the JPY.


