The difference between success and failure in Forex trading is very likely to depend upon which currency pairs you choose to trade each week, and not on the exact trading methods you might use to determine trade entries and exits. Each week I am going to analyze fundamentals, sentiment and technical positions in order to determine which currency pairs are most likely to produce the easiest and most profitable trading opportunities over the next week. In some cases it will be trading the trend. In other cases it will be trading support and resistance levels during more ranging markets.
Big Picture 8th July 2018
In my previous piece last week, I forecasted that the best trades would be long Crude Oil, long USD/JPY, and short NZD/USD. This did not work out well, with WTI Crude Oil falling by 0.55%, USD/JPY falling by 0.18%, and NZD/USD rising by 0.70%. This produced an average loss of 0.48% which is not good, but far from catastrophic.
Last week saw a rise in the relative value of the New Zealand Dollar, and a fall in the relative value of the Swiss Franc, although the price changes were very small, so this does not mean very much.
The market is quiet, indecisive, and relatively difficult to trade profitably right now, even with the major economic data releases concerning the U.S. Dollar last week.
The major event of last week was weaker then expected U.S. employment data, although this cannot be said to have made a major impact upon the U.S. Dollar yet. It is currently difficult to gauge market sentiment which looks likely to be dominated by concerns of a trade war.
Fundamental Analysis & Market Sentiment
Fundamental analysis tends to support the U.S. Dollar, as American economic fundamentals continue to look relatively strong. There is little going on with other major currencies, although the Euro has come to life in recent days and has been bid with some degree of volatility.
The week ahead will probably be dominated by the release of U.S. inflation data at the end of the week.
Technical Analysis
U.S. Dollar Index
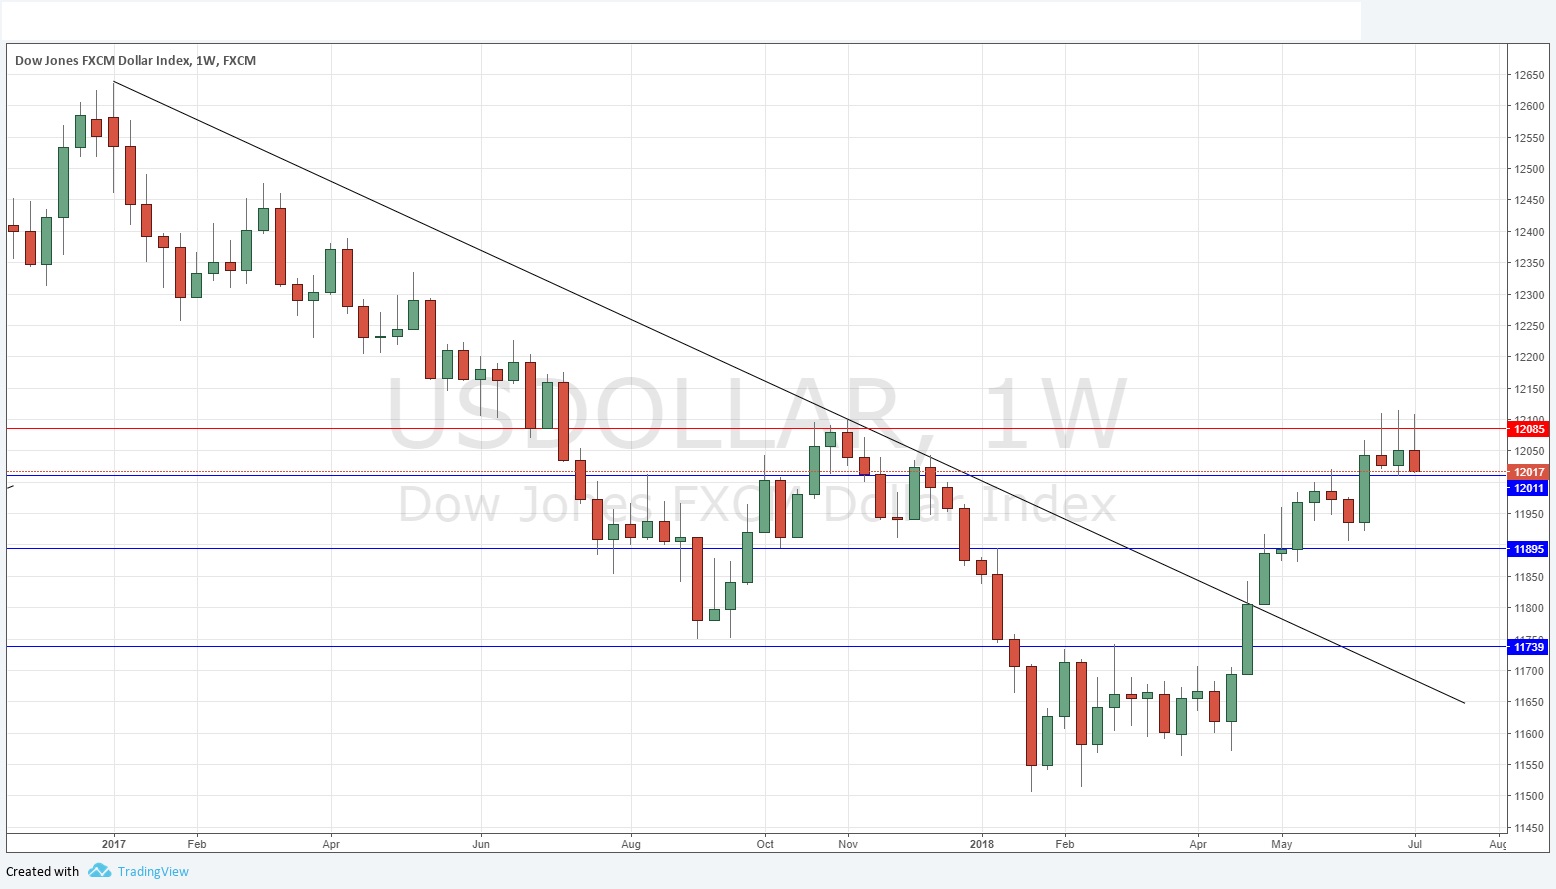
The weekly price chart below shows that for the third week running, a bearish pin candlestick was made over the week, with the Index rejecting the resistance level at 12085 as shown in the price chart below. However, it is remaining above its price level from both 3 months ago and 6 months ago, sitting in a long-term bullish trend. There is also evidence that there is new, higher support at 12011 which is yet to be broken. This produces a partially unclear situation which suggests that the price may be bearish over the short-term, while still in a bullish trend that can be expected to reassert itself. I’d say the repeat of a bearish pin candlestick is a sign of increasing bearishness.
WTI Crude Oil
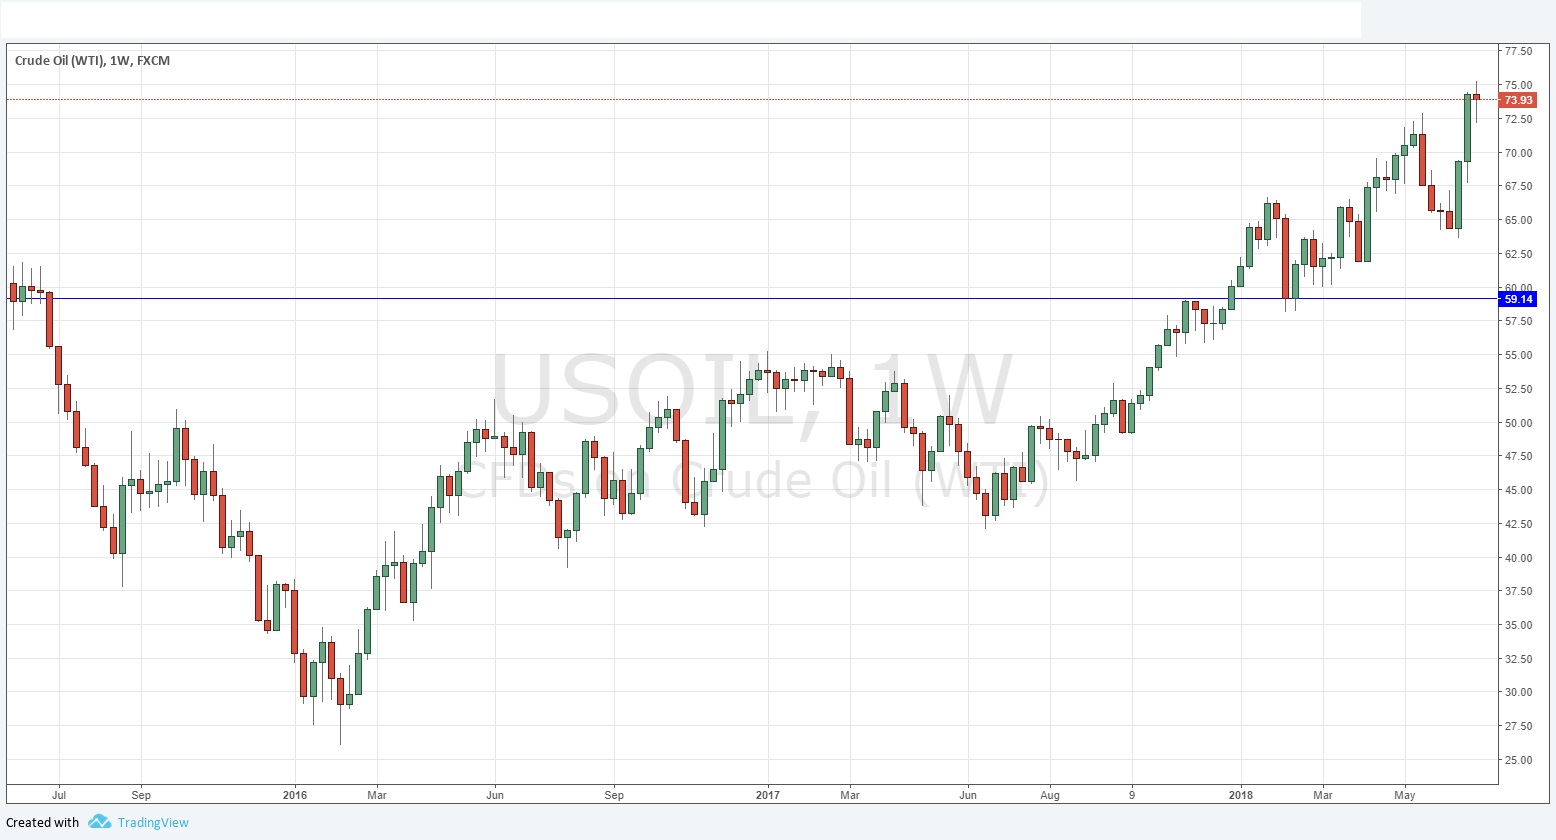
Crude Oil has been very bullish for a long time, continuing to rise and make new multi-year high prices in a strong and persistent trend. Although last week printed a doji candlestick, which is often a sign of indecision, I think there is still a strong case to be bullish here, especially if the price breaks last week’s high price.
EUR/USD
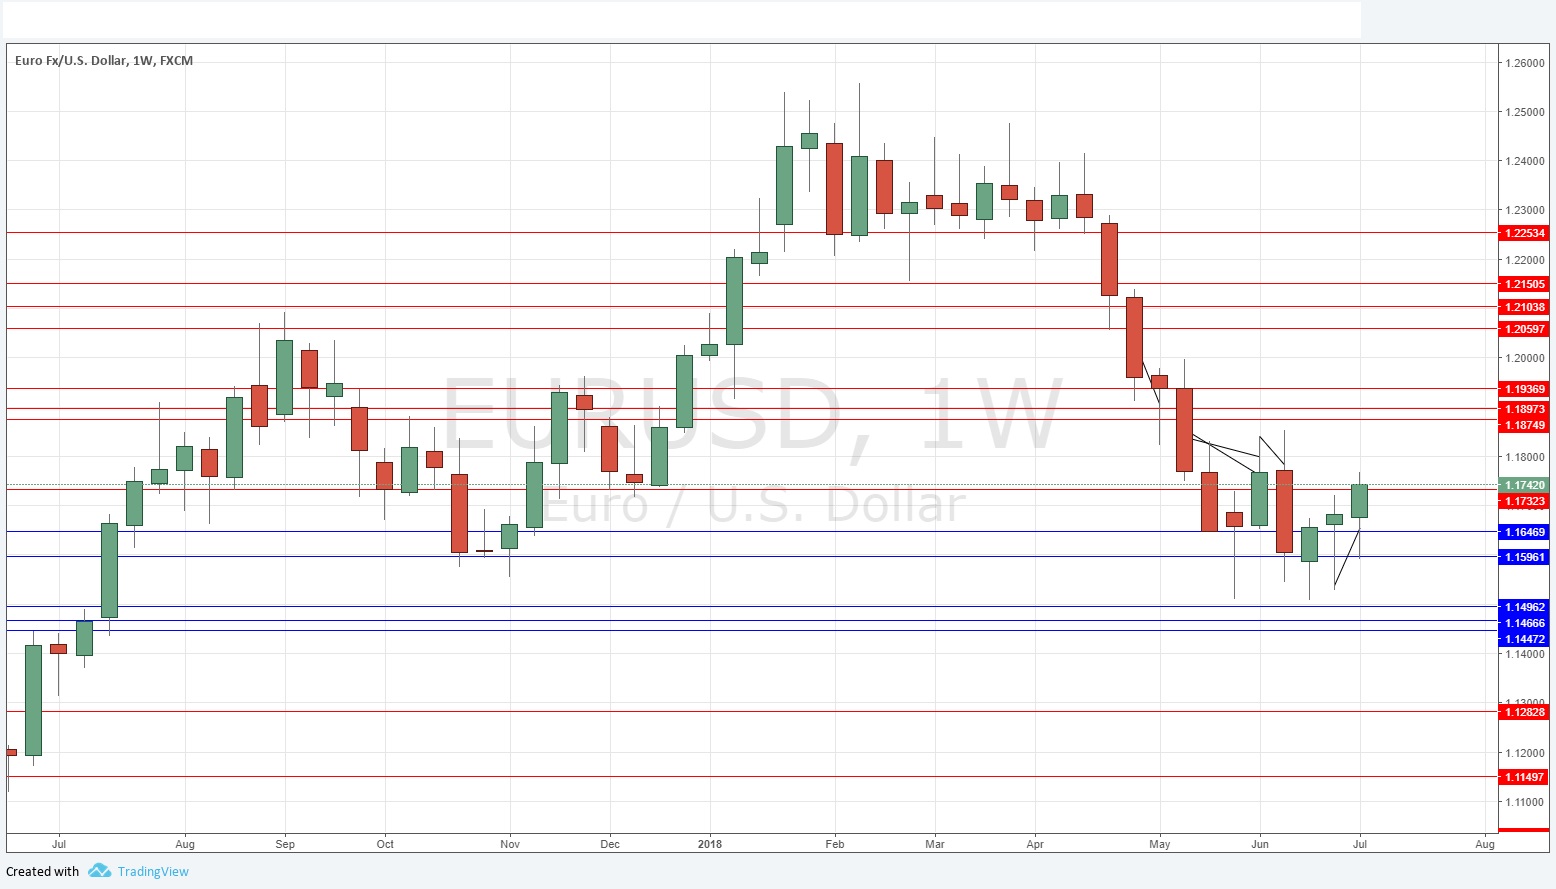
Although this pair is still technically in a long-term bearish trend, recent weeks are signaling a bullish turn, with long lower wicks rejecting the 1.1500 area which was previously inflective, as can be seen in the price chart below. I think the move may not be very strong or far, but it looks like we are likely to see higher prices here next week. This pair is also at the heart of the Forex market now and has some volatility in it.
Conclusion
Bullish on Crude Oil (above last week’s high price) and the Euro, bearish on the USD.


