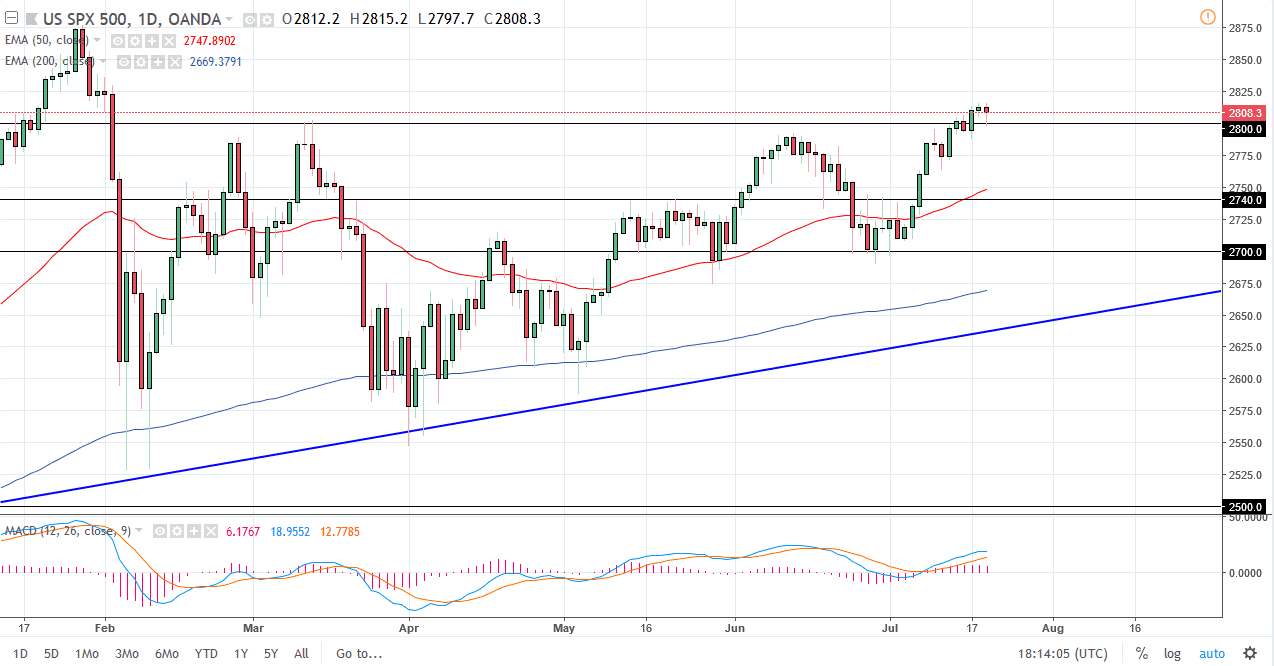
The S&P 500 pulled back a little bit during the trading session on Thursday initially, but found enough support at the 2800 level to turn around and form a hammer. This is obviously a very bullish sign, but I believe that there is a lot of supply near the 2825 handle, so it’s not until we break above there that I think the market will take off to the upside, so in the short term we may continue to see volatility and sideways action overall. I’d be a buyer of dips, and I think there is a significant amount of support down to at least the 2775 handle on the daily chart. Longer-term, I think we would go looking towards the 2880 handle, and then eventually 2900, followed by 3000 on the longer time horizon.
NASDAQ 100
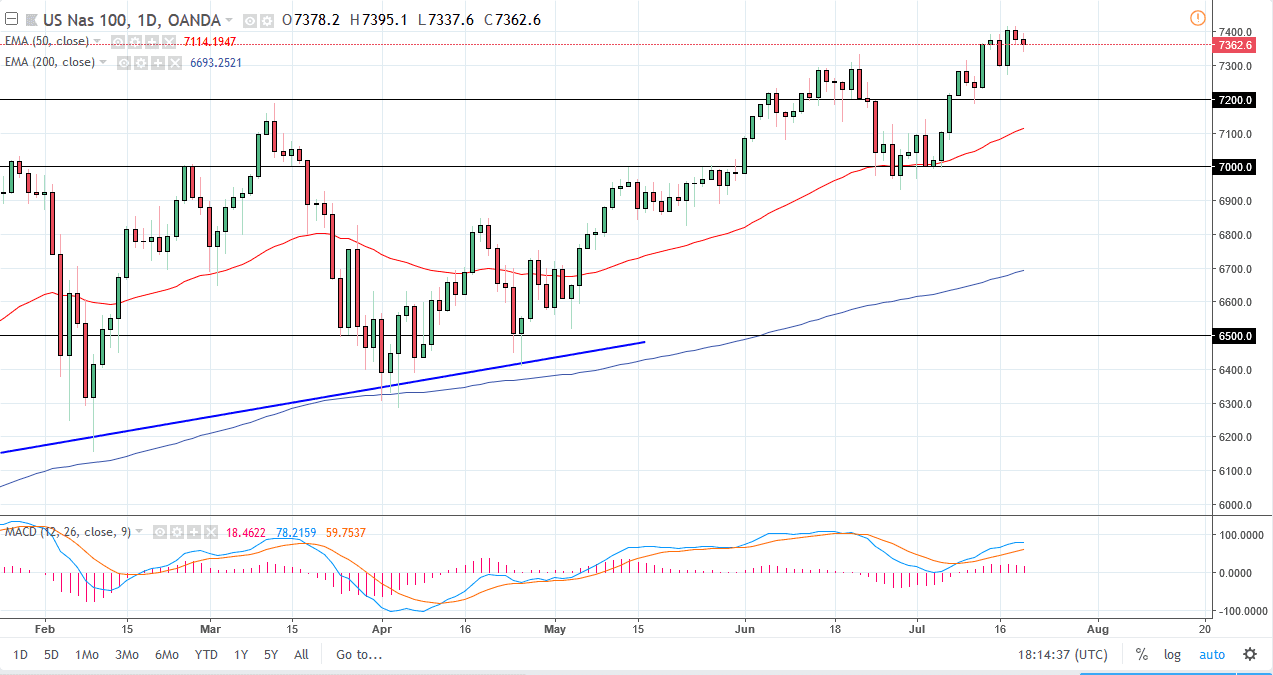
The NASDAQ 100 has been slightly negative for the trading session on Thursday, losing about 0.25% by the time I wrote this article. The market looks as if it does have plenty of support below though, especially near the 7200 level, so I think that there will be buyers looking to get involved on dips. The 7400 level is obviously causing a lot of resistance, but I think that it makes much more psychological sense for the 7500 level to be the target.
Otherwise, if we break down below the 7200 level, the market probably drops to the 50 day EMA initially, followed by the 7000 level which has been the scene of significant demand in this market. At this point, I assume that the 7000 level is essentially the “floor” in the uptrend. If we were to break down below there then the market could probably go much lower, perhaps reaching towards the 6800 level and then the 6500 level.


